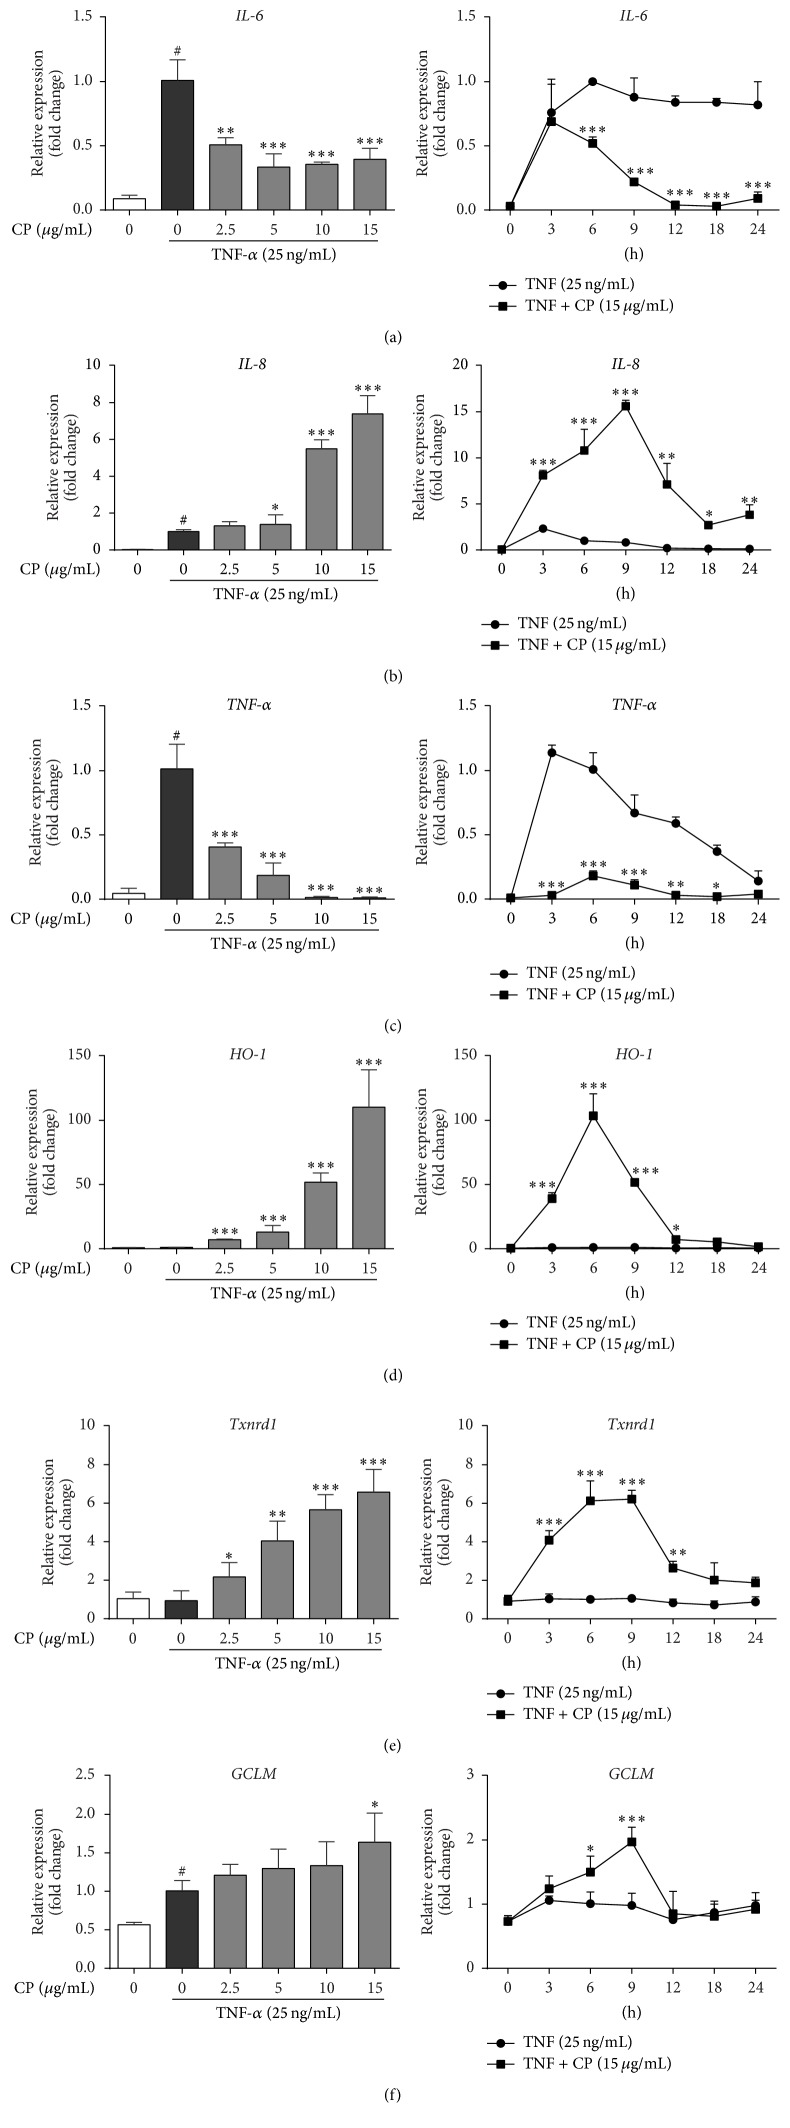
Figure 4.
Time and dose effects of CP treatment on inflammatory cytokine and cellular antioxidant defense gene expressions in TNF-α stimulated MAC-T cells. MAC-T cells were preincubated with different concentrations of propolis for 1 h and then stimulated with 25 ng/mL TNF-α for various time periods (time effects, right) or preincubated with various concentrations of propolis (dose effect, left) and then stimulated with 25 ng/mL TNF-α for 6 h. IL-6 (a), IL-8 (b), TNF-α (c), HO-1 (d), Txnrd-1 (e), and GCLM (f) mRNA expressions were quantified by real-time PCR. Ct values of target genes were normalized to the value of β-actin. Relative gene expression in TNF-α stimulation for 6 h was arbitrarily set to one. The data are shown as mean ± SD from three independent experiments. # P < 0.05 compared to the normal control and ∗significantly different from the TNF-α treated control (P < 0.05). ∗ P < 0.05, ∗∗ P < 0.01, and ∗∗∗ P < 0.001.

