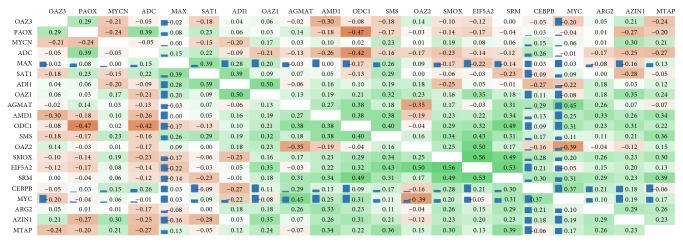
Figure 3.
Results of coexpression analysis for genes participating in polyamine metabolism. Pearson correlation coefficients between the expression levels changes of genes participating in polyamine metabolism and inflammation across 50 colorectal cancer samples are presented. Cell color reflects these values (green: positive, brown: negative). Normalized ChIP-Seq score (according to ENCODE data) is indicated with blue bars.

