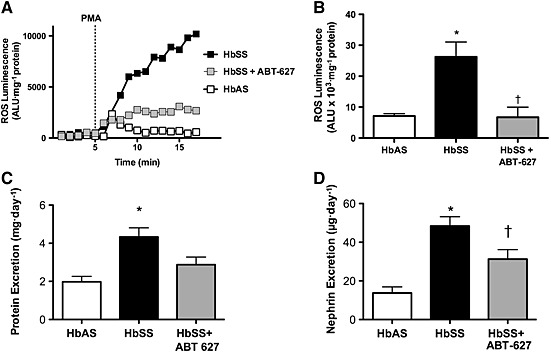
Figure 3.

Representative luminescence reading in glomeruli isolated from control, SCD and SCD mice treated with the ETA receptor antagonist, ABT‐627. (A) Total ROS luminescence was calculated from the area under the luminescence curve and normalized to mg protein (B). Panels C and D depict the average protein and nephrin excretion, respectively, for the three groups of mice. Data are mean ± SEM. *P < 0.05 versus control; † P < 0.05 versus untreated sickle mice; n = 6 or 8.
