Fig. 1.

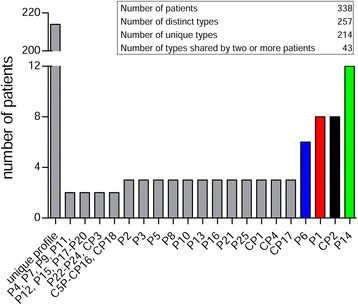
Distribution of isolates among profiles of different sizes. P. aeruginosa isolates were subjected to PFGE and DNA band patterns were analysed. The distribution of isolates among the profiles is shown

Distribution of isolates among profiles of different sizes. P. aeruginosa isolates were subjected to PFGE and DNA band patterns were analysed. The distribution of isolates among the profiles is shown