
Figure 2. Relationship between crow activity and change in carcass biomass (Zero = no change in the carcass biomass during the course of the experiment).
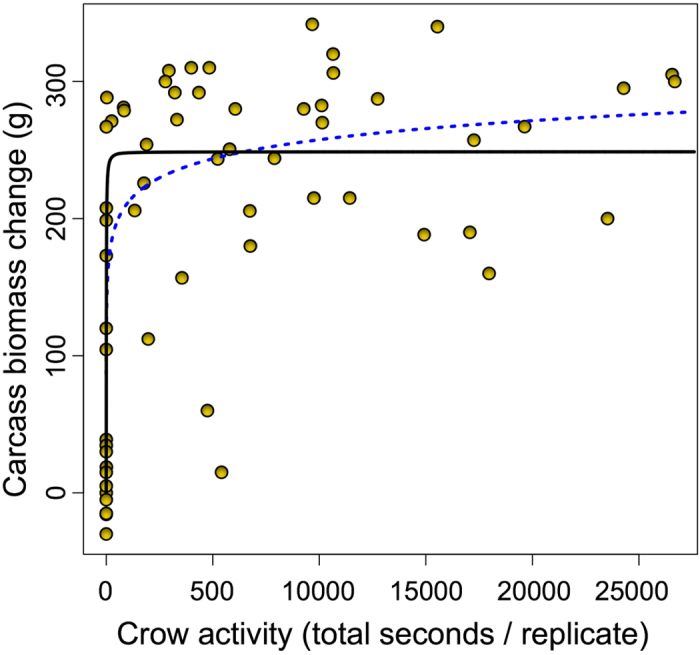
Black solid line is the fit from the Michaelis-Menten asymptotic model (RMSE = 74.4), blue dotted line is the fit from the exponential model (RMSE = 80.0, R2 = 0.49).