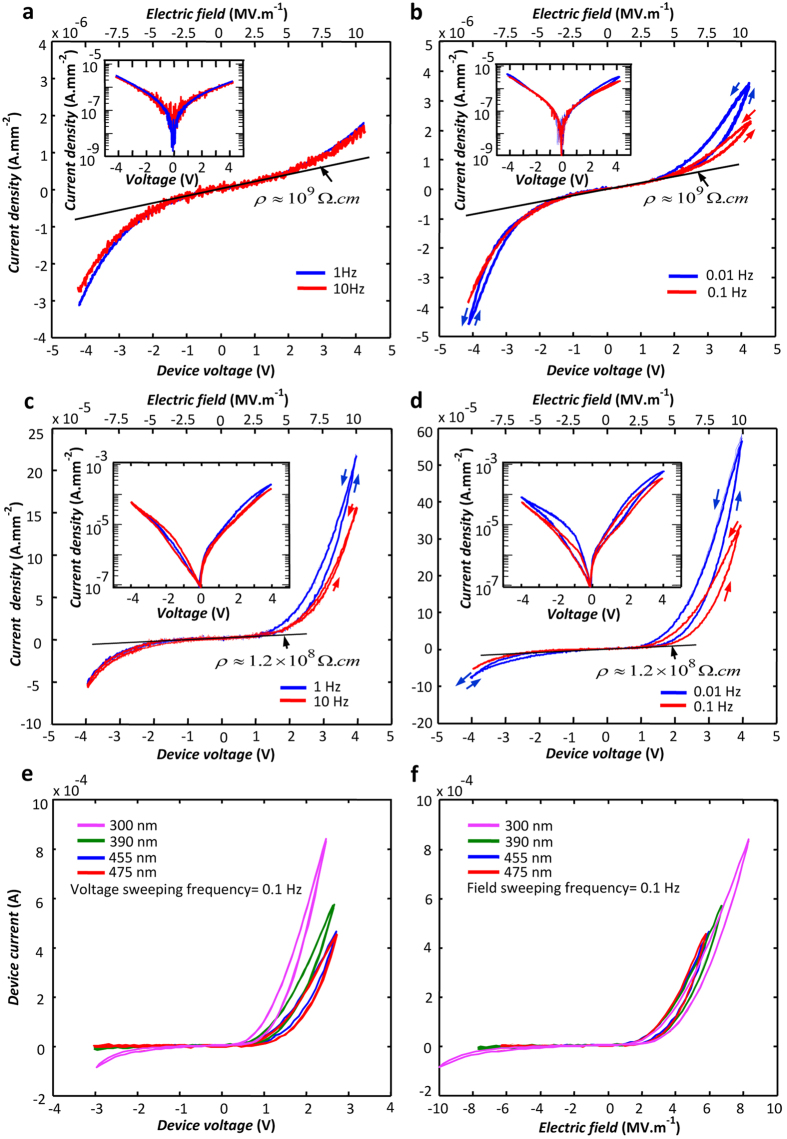
Figure 2. The experimental current density vs. voltage diagrams of different samples.
The diagrams are plotted at the stated voltage sweeping frequencies for an A-sample (a,b) and for a B-sample (c,d); both samples are made of 400 nm thick oxide layers; the respective semi-logarithmic plots of the diagrams are presented as insets. The diagrams obtained for four B-samples with the stated thicknesses (e) match when presented in the current density vs. electric field form (f). All measurements are carried out in clean air with 23% relative humidity at room temperature.

