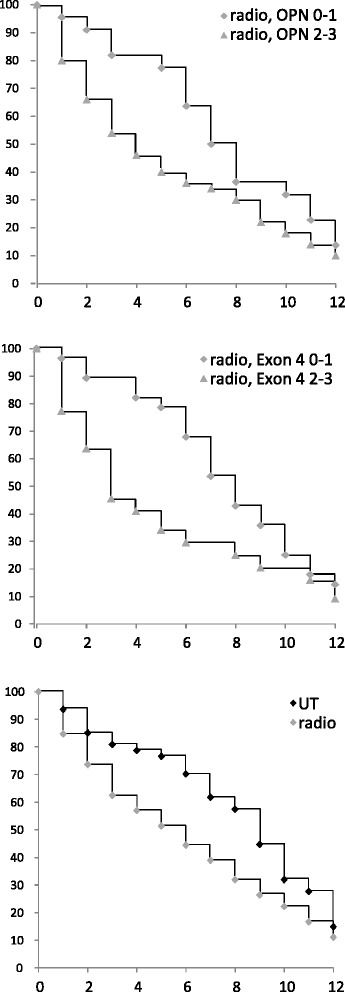
Fig. 3.

Kaplan-Meier survival curves for patients undergoing radiotherapy. Survival of patients under radiotherapy, distinguished according to low (0–1, diamonds) versus high (2–3, triangles) immunohistochemical markers. Shown are Kaplan Meier curves for osteopontin-c (top panel) or exon 4 (middle panel). For comparison, the survival of all patients receiving radiation (gray markers) or not treated with radiation (black markers) is displayed (bottom panel). The x-axis indicates years since diagnosis, the y-axis reflects % surviving patients
