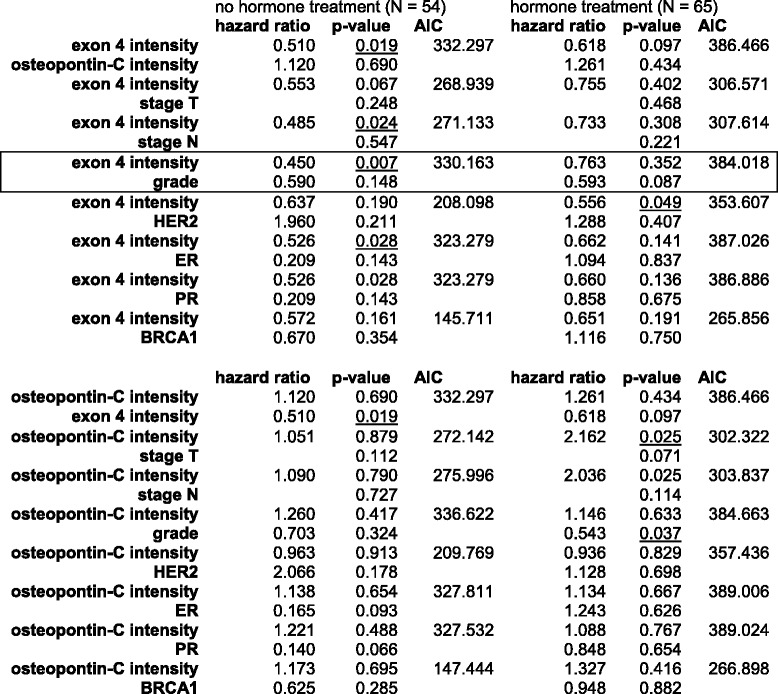
Table 7.
Multivariate analysis

Hazard ratios and p-values for survival under hormone therapy, using exon 4 staining (0–1 = low, 2–3 = high) or osteopontin-c staining (0–1 = low, 2–3 = high) plus other readouts as covariates. The combination of exon 4 intensity plus grade, which strengthens the prediction compared to exon 4 intensity alone, is boxed
