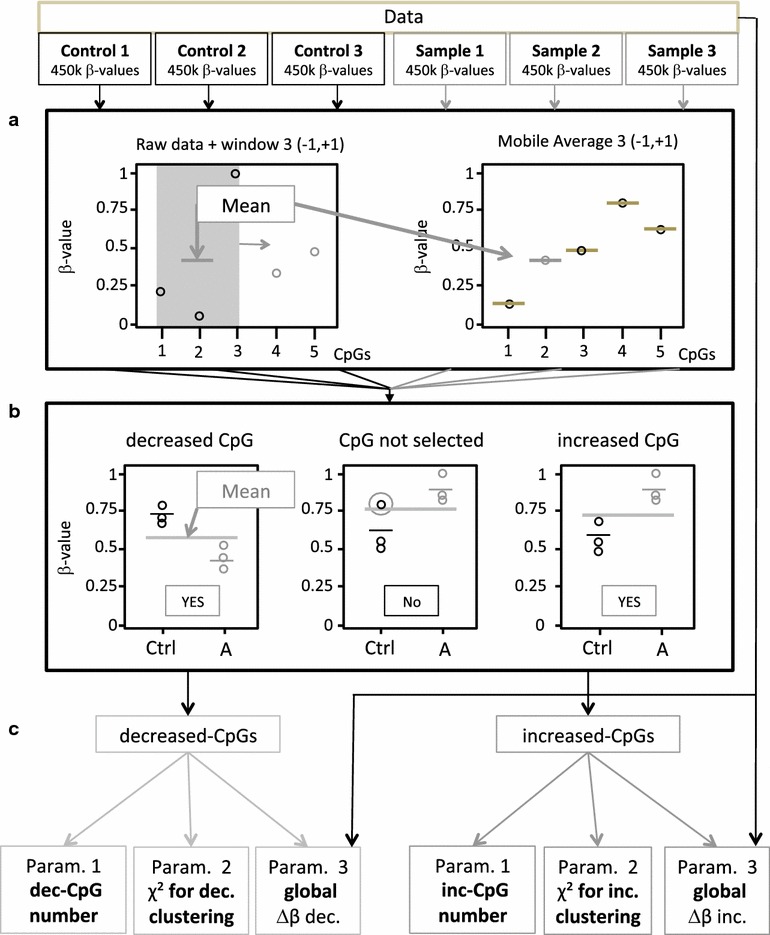
Fig. 1.

Workflow of data analysis and representation. The normalized β-values of triplicate samples and their corresponding controls are analyzed using the DAT algorithm as described in the text. a First, a moving average <β> is calculated for each CpG position in each sample and control. The average of all six sample <β> values is calculated ≪β≫. b The methylation level of a given CpG is considered as “increased” in the samples compared to controls if all the <β> values are higher then ≪β≫ or decreased if lower then ≪β≫. The above operation is repeated for all CpG-s analyzed by the Illumina chip. c Three parameters are calculated on the basis of the lists of “increased” and “decreased” CpG-s: (1) the total number of CpG-s (N); (2) chi2 calculated on the basis of the observed distribution of the CpG cluster sizes compared to the simulated random distribution of cluster sizes obtained with an identical number of CpG sites; (3) the median delta-β value of all the N CpG-s
