Figure 8.

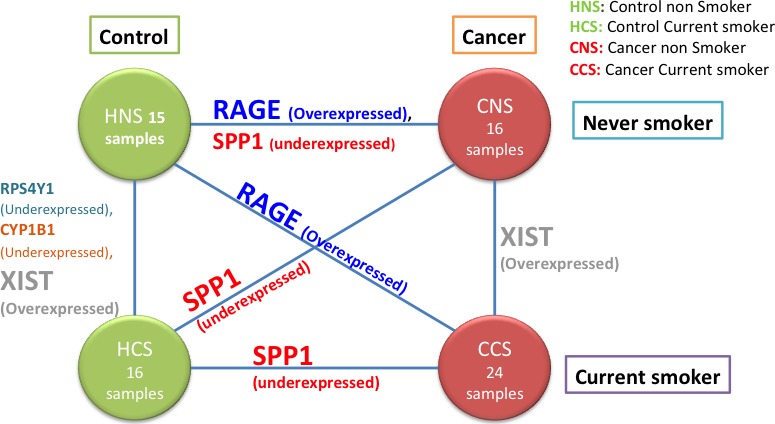
Diagram representing six analyses between four different conditions (HNS, HCS, CNS, CCS). The edges of the graph list the genes in the associated Pareto‐efficient frontier.

Diagram representing six analyses between four different conditions (HNS, HCS, CNS, CCS). The edges of the graph list the genes in the associated Pareto‐efficient frontier.