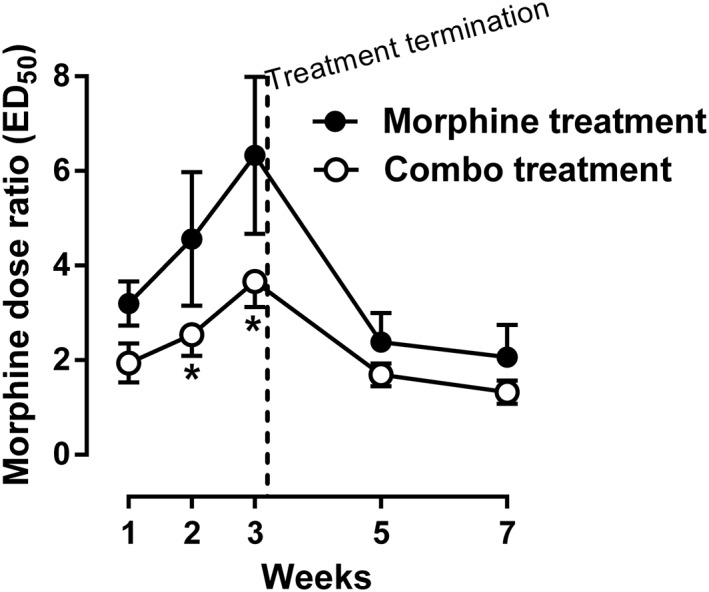
Figure 3.

Dose ratio of morphine during and after chronic treatment of either morphine alone or morphine in combination with 2‐BFI compared with control on week 0. Data were expressed as the dose ratio of morphine and plotted as a function of time (weeks). *P < 0.05; significantly different from the morphine treatment group; two‐way repeated measures ANOVA, followed by Bonferroni's test; n = 9 per group.
