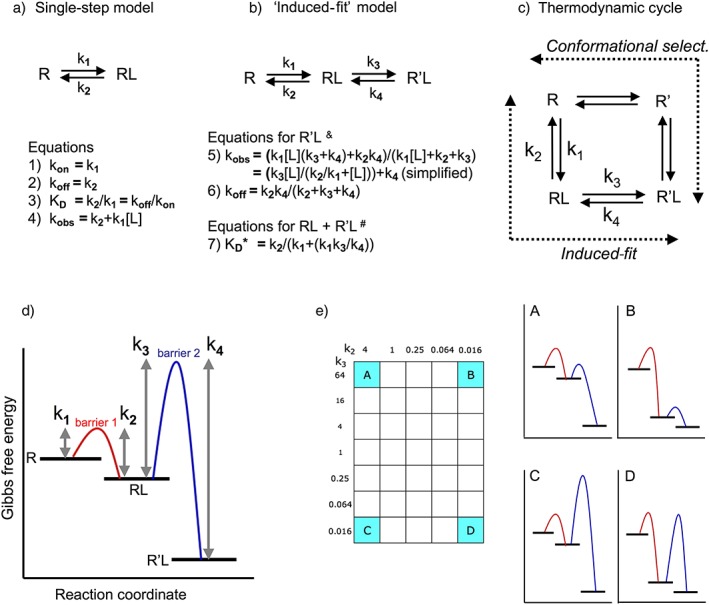
Figure 1.

Schematic representation of (panels a to c) the binding mechanisms that are considered in this review and (panels d and e) free energy reaction coordinate diagrams of the distinct two‐step, binding situations. (a) Single‐step bimolecular binding process that obeys the law of mass action. (b) Induced‐fit model in where such bimolecular binding is followed by an isomerization of the initial RL complex into a more stable R'L complex (pertinent when k4 < k2, equations from Strickland et al. 1975; Tummino and Copeland, 2008; Lu and Tonge 2010). &Those equations apply to the timewise evolution of R'L. Because kobs and koff are macroscopic first‐order rate constants, they can be used for the analysis of association and dissociation curves when mono‐exponential; otherwise, they only apply to the slower component if such curves can be analysed in terms of a bi‐exponential model. # K D* equals [L] at which the observed binding (in where both RL and R'L participate) is half‐maximal at equilibrium. K D* acts as a ‘macroscopic’/pseudo‐binding ‘affinity’ constant. (c) More complete thermodynamic cycle model in which the receptor, R, undergoes a conformational change to yield R' either after binding of the L (according to the ‘induced‐fit’ model) or before (according to the ‘conformational selection’ model). These mechanisms correspond to the two lanes (designated by the dashed arrows) of the cycle that allow a bidirectional flow between R and R'L. Although the difference in free energy between R and R'L is fixed, all microscopic kinetic constants may differ. Please see Tummino and Copeland, 2008; Copeland, 2010, 2011 for more information. (d) General description of a two‐step reversible binding processes (Lu and Tonge, 2010; Copeland, 2011). R, RL and R'L correspond to plateaus with decreasing Gibbs free energy. To proceed from one plateau to an adjacent one, the ‘system’ must overcome an energy barrier in the appropriate direction. This barrier is known as the transition state. The difference in height between each barrier and the adjacent plateaus is inversely related to the magnitude of the corresponding ‘microscopic’ rate constants that are necessary to attain that barrier. The difference in free energy between the ground state R and the final R'L state, ∆G0 is related to those microscopic rate constants by the equation ∆G0 = −RTln K D in where K D (the ‘thermodynamic’ equilibrium KD) equals (k2.k4)/(k1.k3), R the ideal gas constant and T the temperature in degrees Kelvin. (e) Free energy reaction coordinate diagrams for the ligands that correspond to the cardinal points (A to D) of the two‐dimensional ‘kinetic space’ showing the investigated k2–k3 combinations (further referred to as the ‘grid’). The diagrams are for illustrative purposes only; the differences between the plateaus and the elevation of the energy barriers only provide a qualitative distinction between the microkinetic K D values and rate constants.
