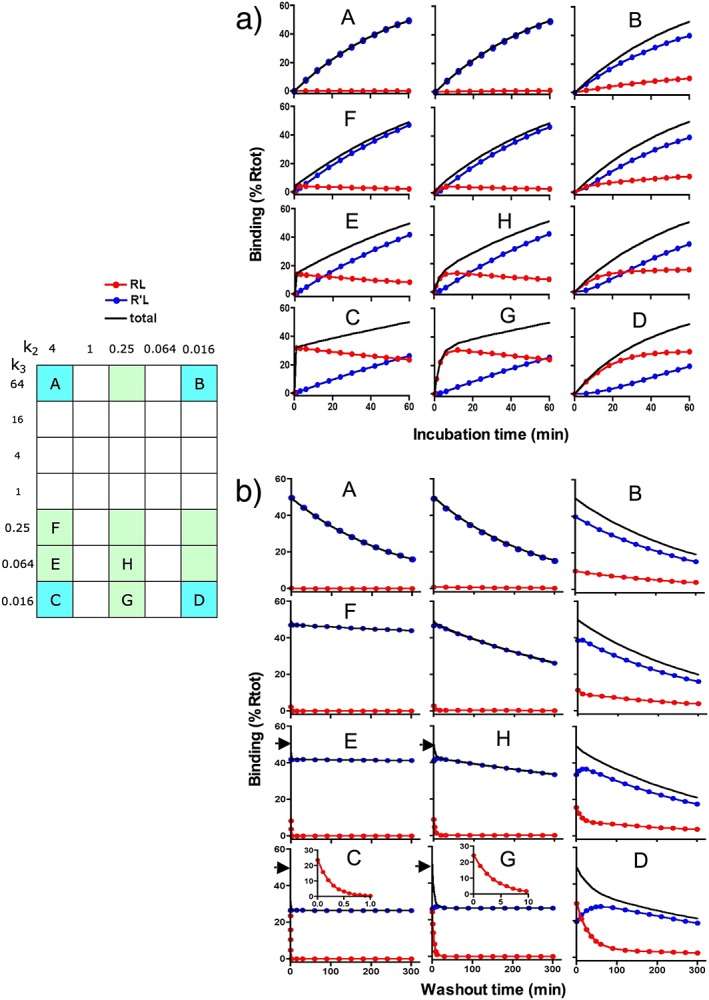
Figure 3.

Simulated association and dissociation curves. Differential equations for the present simulations are given in the Supporting Information. Plots for representative ligands are shown in the same 2D configuration as those that are highlighted in the grid and an alphabetical character designates those that are subjected to closer scrutiny. Each of those plots shows values of RL, R'L and total binding (‘total’ = RL + R'L) individually. (a) Simulated association curves are shown for up to 60 min incubation and for a better comparison, they are preformed with a value of [L] that yields 50% receptor occupancy (i.e. ‘total’ = 50% Rtot) at the end. (b) Simulated dissociation curves are shown for up to 300 min washout during which remaining binding is recorded at different time intervals. The washout starts with ‘total’ = 50% Rtot and is triggered by setting [L] = 0 (which corresponds to replacing the ligand‐containing medium by naïve one). Arrows at the ordinate of D, E, G and H show the amount of initial total binding. Inserts in C and G show the decline in RL when the timescale is expanded. Values of R'L (for A, C, E and F) and of ‘total’ (for all other highlighted ligands) are analysed according to a one‐phase or two‐phase exponential association or dissociation paradigms where appropriate. Macroscopic rate constants are shown in Tables 2, 3 for the ligands that are designed by an alphabetical character.
