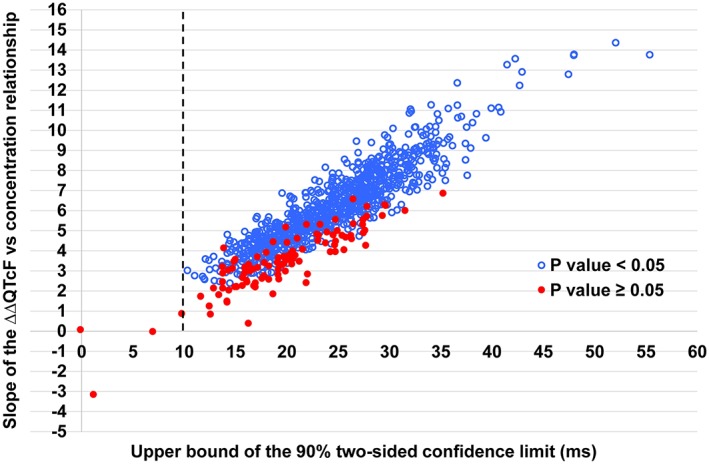
Figure 4.

Distribution of the slope of the placebo‐adjusted change from baseline for QTcF (ΔΔQTcF) versus concentration relationship for moxifloxacin and the upper confidence limit for ΔΔQTcF at mean C max for the 1000 simulated datasets. Only four datasets had an upper confidence limit for ΔΔQTcF that was less than 10 ms (seen as falling to the left of the vertical line). For 105 datasets, the slope of the ΔΔQTcF versus concentration relationship for moxifloxacin did not reach statistical significance (P≥ 0.05).
