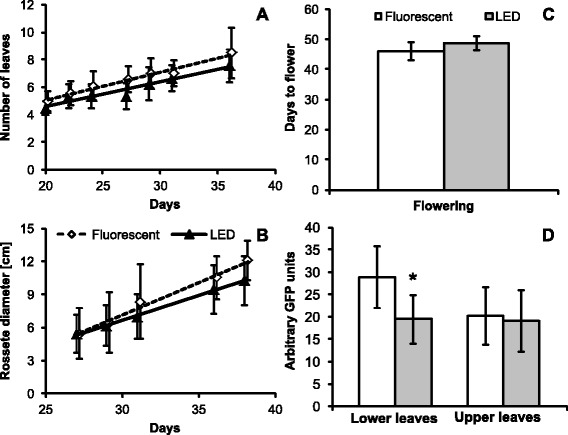
Figure 3.

Growth of N. benthamiana plants under different illumination sources. Number of leaves (A) and rosette diameter (B) were recorded throughout the experiment. C) Average number of days from germination to the appearance of first flower. Values in panels A to C are based on one of two biological replicates, each group consisted of 11 plants. D) Total protein extracts from leaves inoculated with virus vector expressing GFP. One of two biological replicates, n = 9. Error bars represent SD.
