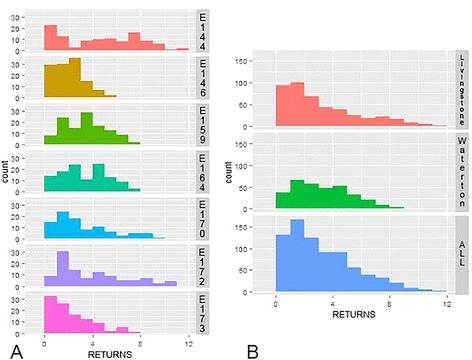
Figure 2.

Distribution of return frequency to clusters by (A) Individual and (B) Herd across the summer season. Histograms depicting frequency of returns to identified foraging patches are presented for each individual cow and each herd cumulatively. These histograms demonstrate the wide variation present across individual and herd return frequencies, potentially influenced both by differences in habitat and behaviour across the season.
