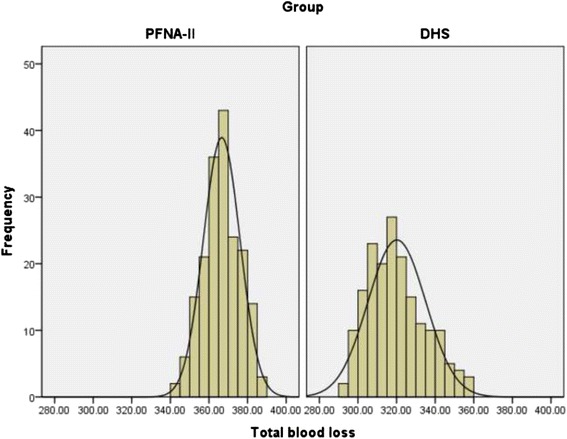
Fig. 3.

Frequency distribution of the total blood loss measurements. Its concentration is shown as the obviously centralized distribution in two groups, and in Group PFNA-II, most of the values are approximately 368 ml, in Group DHS, approximately 320 ml.DHS, dynamic hip screw; PFNA-II, Asia-proximal femoral nail anti-rotation
