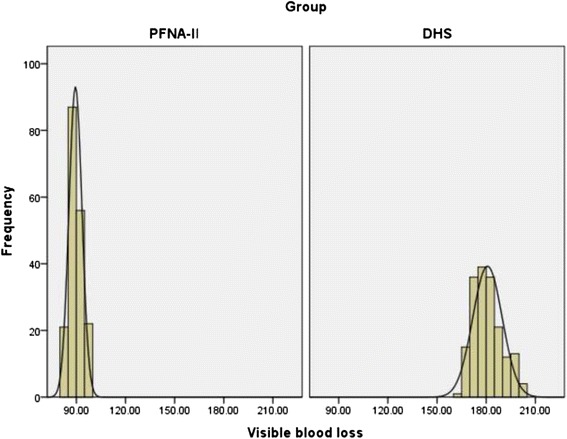
Fig. 5.

Frequency distribution of the visible blood loss measurements. Its concentration is shown as the obviously centralized distribution in two groups, and in Group, most of the values are approximately 89 ml, in Group DHS, approximately 180 ml.DHS, dynamic hip screw; PFNA-II, Asia proximal femoral nail anti-rotation
