Fig. 6.

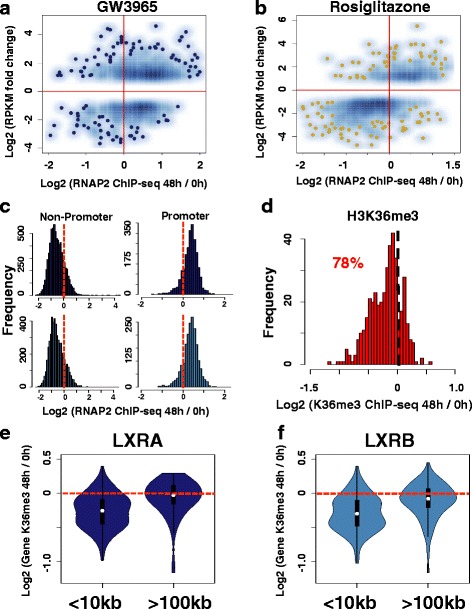
LXR repression is consistent with RNAP2 promoter-proximal pausing. a Smooth scatter plot comparing RNA-derived gene expression levels after 48-h GW3965 treatment (y-axis, reads per kilobase of transcript per million mapped reads (RPKM)) with sequencing read depth ratios of ChIP-derived RNAP2 promoter occupancy (x-axis). Read depth at promoters assesses the enrichment after 48 h of GW3965 (48 h) normalized to control culture conditions (0 h). Data are presented for all GW3965 responsive genes (adjusted p < 0.01, fold change cutoff of ±2). b Smooth scatter plot comparing RNA-derived gene expression levels after 48 h of rosiglitazone stimulation (y-axis, RPKM) with sequencing read depth ratios of ChIP-derived RNAP2 promoter occupancy (x-axis). Read depth at promoters assesses the enrichment after 48 h of rosiglitazone (48 h) normalized to control culture conditions (0 h). Data are presented for all rosiglitazone-responsive genes (adjusted p < 0.01, fold change cutoff of ±2). c Histogram tabulating the read depth ratios (x-axis) of RNAP2 enrichment sites co-occupied by LXRA and RNAP2 (top panel) and sites co-occupied by LXRB and RNAP2 (bottom panel). Co-occupied sites are divided based on promoter location (Non-Promoter and Promoter). Negative values highlight stronger enrichment under control culture conditions (0 h) while positive values denote stronger enrichment after 48 hours of GW3965 treatment. d Histogram tabulating the read depth ratios (x-axis) of H3K36me3 enrichment in gene bodies for genes down-regulated after 48 h of GW3965 treatment. Negative values highlight stronger enrichment at baseline (0 h) while positive values denote stronger enrichment after 48 h of GW3965 treatment. e Violin plot of changes in H3K36me3 read depth ratio in gene bodies of repressed genes after 48 h of GW3965 treatment. Plots are displayed for genes that harbor LXRA binding events within 10 kb (<10 kb) from promoters, as well as plots for genes with no evidence of nearby LXRA occupancy (>100 kb). f Violin plot of changes in H3K36me3 read depth ratio in gene bodies of repressed genes after 48 h of GW3965 treatment. Plots are displayed for genes that harbor LXRB binding events within 10 kb (<10 kb) of promoters, as well as plots for genes with no evidence of nearby LXRB occupancy (>100 kb)
