
Fig. 4.
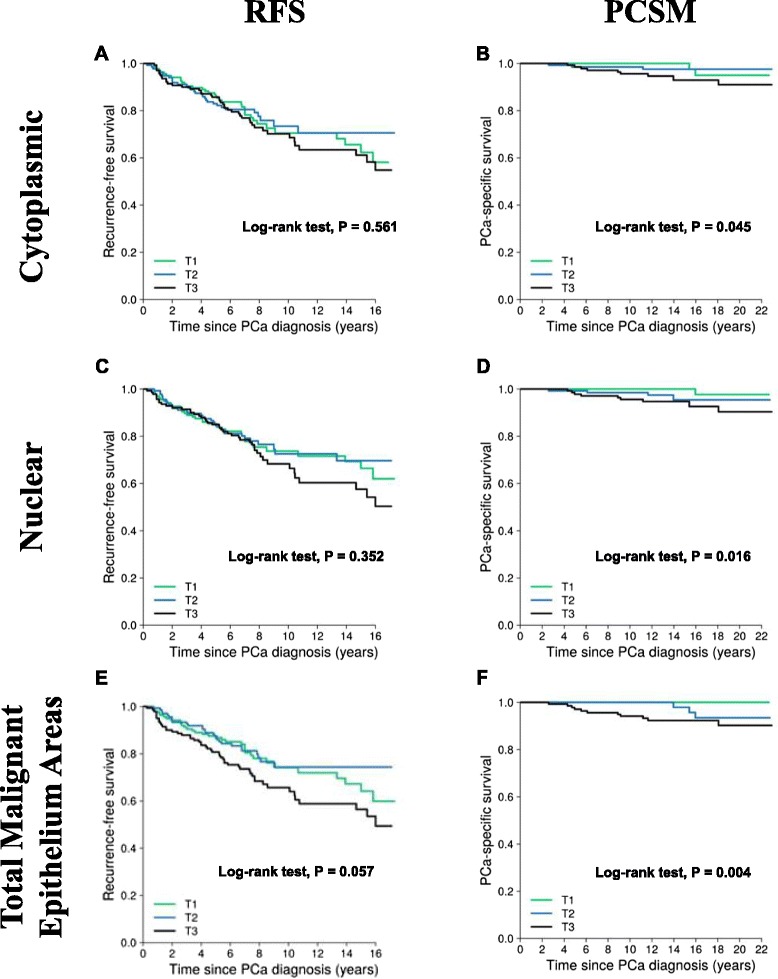
Probability of PCa RFS and PCSM for ERβ2 staining quantified by image analysis. Kaplan-Meier plot for PCa recurrence-free survival using tertiles of ERβ2 intensity quantified by the Cytoplasm algorithm (Aperio) confined to tumor cytoplasm (a), tumor nuclei (c), or by the Color Deconvolution algorithm (Aperio) for area-based quantification confined to tumor cells including cytoplasm and nuclear staining (e). Kaplan-Meier plot for PCa-specific survival using tertiles of ERβ2 intensity quantified by the Cytoplasm algorithm (Aperio) confined to tumor cytoplasm (b), tumor nuclei (d), or by the Color Deconvolution algorithm (Aperio) for area-based quantification confined to tumor cells including cytoplasm and nuclear staining (f)