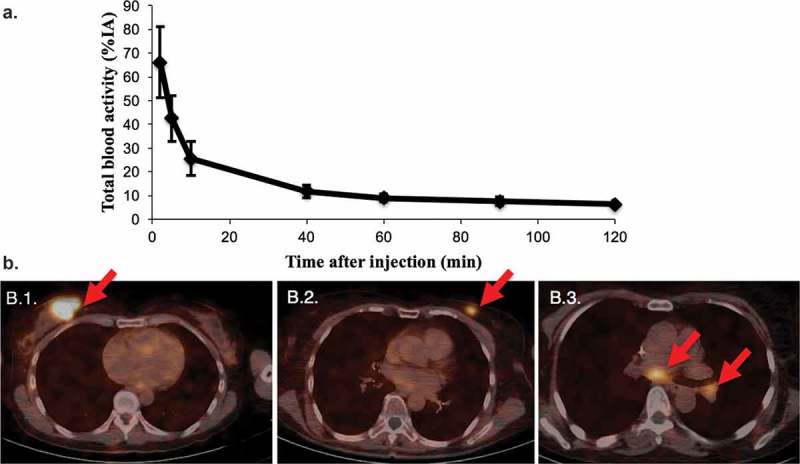
Figure 3.

Diagnostic tumor imaging using 68Ga-HER2-nanobody in patients with HER2pos-breast cancer. a. Time-activity curve of total blood activity, expressed in % of injected activity (%IA) (n=20). b. Fusion PET/CT images of the uptake of 68Ga-HER2-nanobody in breast carcinoma lesions. (B.1.) Patient with the highest tracer uptake (SUVmean 11.8) in a primary breast carcinoma. (B.2.) Patient with moderate tracer uptake in the left breast, which is easily discernable from background (SUVmean 4.9). (B.3.) Patient with invaded lymph nodes in the mediastinum and left hilar region. Lesions are indicated by red arrows. Figures are adapted with permission from.[110].
