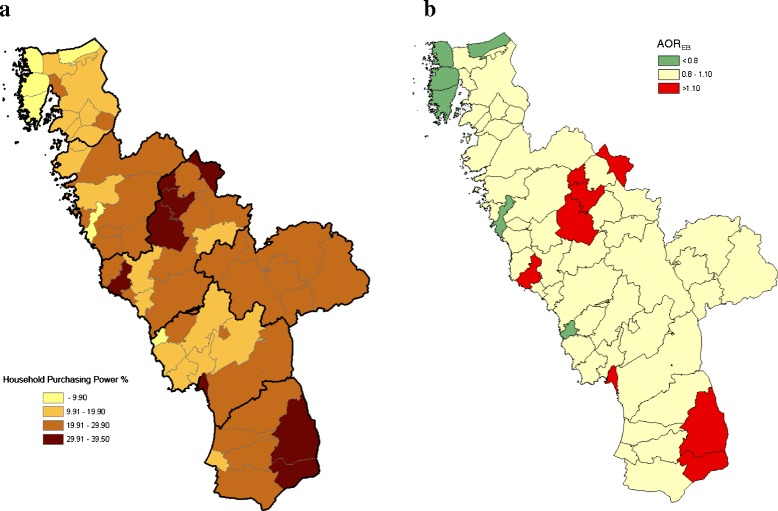
Fig. 1.

Geo-map of neigbourhood purchasing power. a Geo-map of household purchasing power for the 58 parishes in the County of Halland. The residential areas (parishes) were classified into <10 %, 10–19 %, 20–29 % and ≥ 30 % based on this indicator [according to the Swedish standard, corresponding to ≤ USD 19, 500 annual household purchasing power among all resident families with at least one child (≤19 years old: family with the same residential address)]. Household purchasing power was defined as total family disposable income adjusted for the composition of the family (number of adults and children). b The corresponding geo-map, based on the grouping of the parishes according to neighbourhood-level purchasing power (a), for relative risks of overweight at four years of age, denoted AOREB, by stratification of child’s gender, LGA, mother’s BMI before pregnancy (≤25, 25–30, 30+), father’s BMI (≤25, 25–30, 30+) and parental educational level (none post-secondary, one post-secondary, both post-secondary)
