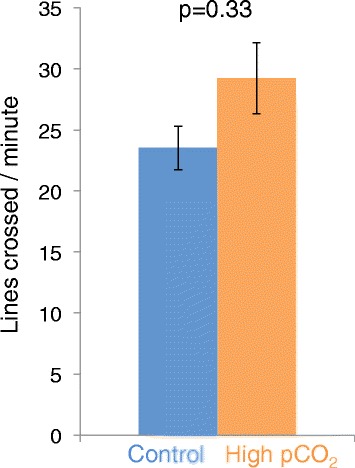
Figure 1.

Atlantic cod swimming activity in control and high CO2 water. Mean activity levels of Atlantic cod measured as lines crossed per minute during a 30-minute period. The fish were exposed to either control water or high-pCO2 water for 12–19 days prior to testing (ncontrol = 22, nCO2 = 23). The data represent the mean ± SEM
