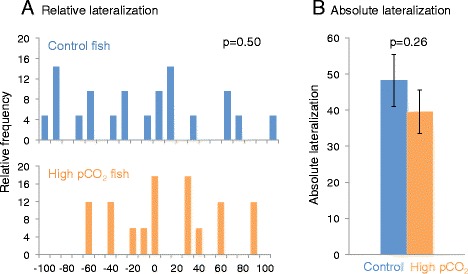
Figure 3.

Relative and absolute lateralization in Atlantic cod exposed to control or high CO2 water. A. Relative lateralization (frequency in %) of Atlantic cod after 30 days of exposure to either control pCO2 conditions (blue) or high-pCO2 conditions (orange) (ncontrol = 21 and nCO2 = 17), where −100 represents 100% left turns and 100 represents 100% right turns. The vertical axis shows the frequency (%). B. Mean absolute lateralization; ncontrol = 21 and nCO2 = 17). The data represent the mean ± SEM.
