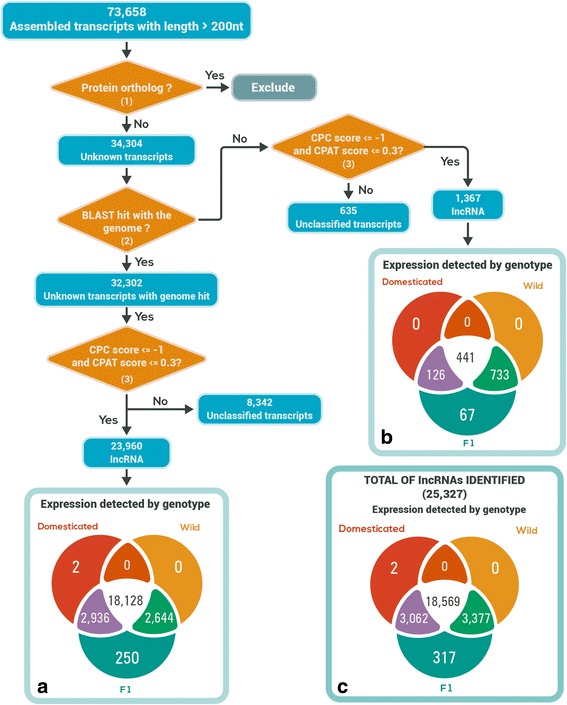
Fig. 2.

Bioinformatic pipeline to determine the lncRNA nature of transcripts and Venn diagrams with number of lncRNA expressed by genotype. Protein coding was determined by comparing transcripts with peptide databases (TAIR 10, NCBI RefSeq and sunflower peptides); all transcript with one or more hits to peptides with a bitscore ≥ 90 and E value < 1e-6 were discarded as potential lncRNAs in (1). To determine if the transcripts had a blast hit with the draft of the sunflower genome, a threshold of bitscore ≥ 90 and E-value < 1e-6 was employed in (2). Only transcripts with a CPC score ≤ −1 and CPAT score ≤ 0.3 were considered as lncRNA by filters in (3). Venn diagrams: a) Expression of lncRNAs with significant similarity with the sunflower genome. b Expression of lncRNAs with no significant similarity with the sunflower genome. c Total number of lncRNAs detected
