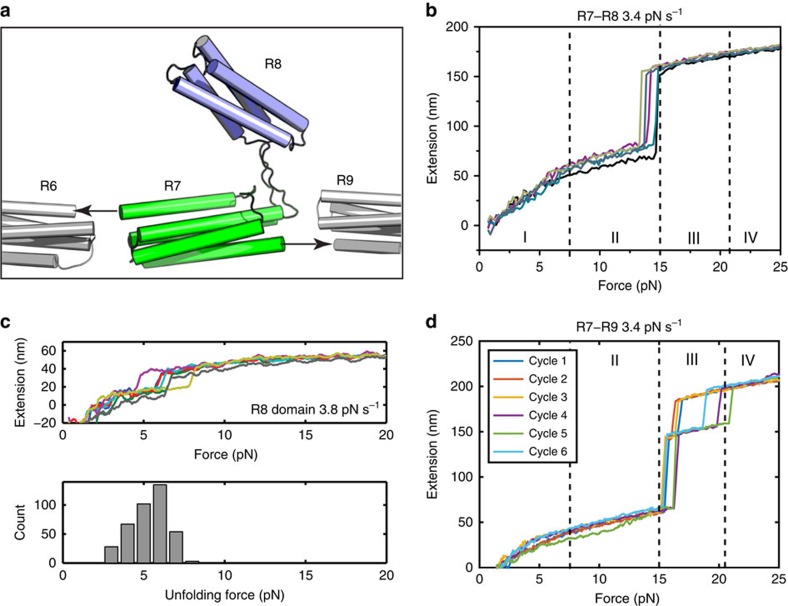
Figure 3. Mechanical properties of the talin R8 domain.
(a) Structure of R7–R8 showing the unique domain organization with R8 (blue) inserted into a loop in R7 (green). The arrows show the direction of the neighbouring domains R6 and R9 and the applied force. (b) Unfolding force-extension curves of R7–R8 at 3.4 pN s−1. (c) Unfolding force-extension curve and unfolding force histogram of R8 alone at 3.8 pN s−1. (d) Unfolding force-extension curves of R7–R9 construct at 3.4 pN s−1 loading rate. The data were smoothed by 0.05 s time window for clearer presentation. In b and d, the unfolding force ranges corresponding to respective groups defined in Fig. 2b are indicated.

