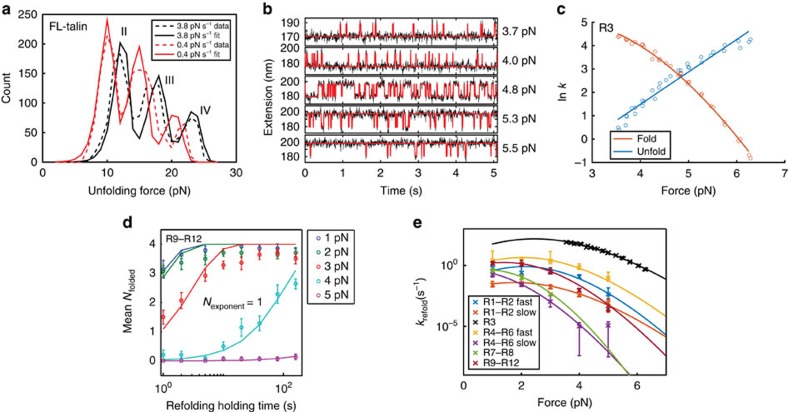
Figure 5. Quantification of force-dependent talin unfolding/refolding kinetics.
(a) Fitting the unfolding force histograms of group II–IV FL-talin rod domains using the Bell's model at two different loading rates of 3.8 (black) and 0.4 pN s−1 (red). The dashed lines represent experimental data and solid lines represent the least squared sum fitting of the experiment data using Bell's model. (b) The equilibrium unfolding/refolding fluctuation of talin R3 domain at constant forces. The black curve denotes the raw data and the red curve denotes the digitized two-state fluctuations determined by hidden Markov model6. (c) The force-dependent unfolding and refolding rates of talin R3 domain determined by analysis of the lifetime distributions of unfolded/folded states under constant forces6,38. The dots represent rates determined from experiments. The red solid line denotes the fitting curve of the refolding rates based on Arrhenius law. The blue solid line denotes the fitting curve of the unfolding rates based on Bell's model. (d) The mean number of refolded domains in R9–R12 after an initially completely unfolded R9–R12 by high force was held at low forces (1–5 pN) for varying time intervals. The refolding rate at each force can be determined by exponential fitting to the data obtained at corresponding force (solid lines). The error bar denotes standard error of the mean. (e) The force-dependent folding rates of talin sub-segment constructs. The error bars denote 95% confidence interval of folding rate estimation. The solid lines denote fitting based on Arrhenius law. For talin R4–R6 and R1–R2, two exponents were required to account for the different refolding kinetics of the individual domains (denoted by ‘fast' and ‘slow') (Supplementary Fig. 3). For talin R9–R12, the refolding kinetics can be described by a single exponent. The refolding rate of R3 (black crosses) and its fitting with Arrhenius law (black solid curve) was determined from constant force measurements (the same data in c, plotted for comparison).

