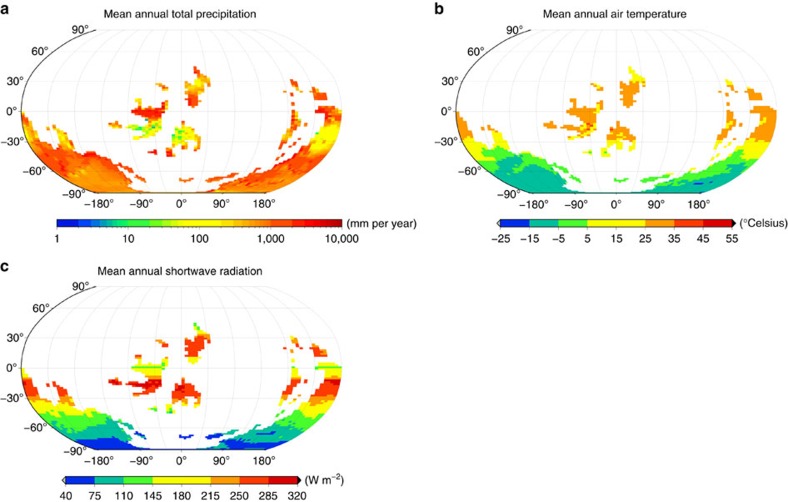
Figure 6. Simulated Ordovician climate.
Global patterns of (a) total precipitation, (b) near-surface air temperature and (c) shortwave radiation for the Late Ordovician (450 Ma). The atmospheric CO2 concentration is 2,240 p.p.m. (8 PAL). The maps show average values over the whole time series of the interpolated climate variables that are derived from the monthly LMDZ output.

