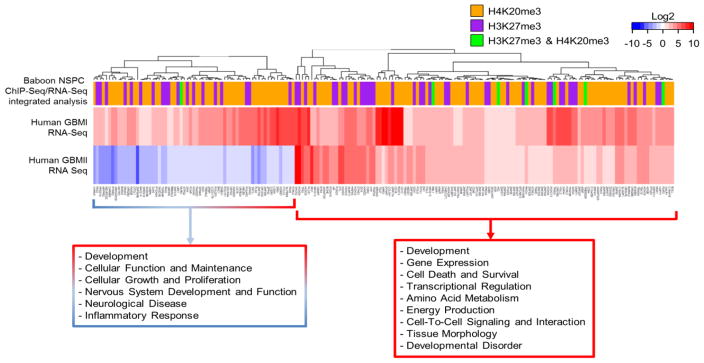
Fig. 10.
Correlation between genes in normal NSPCS enriched with H3K27me3 or H4K20me3 without detectable transcripts and genes altered in MRI-classified group I and group II GBM A heatmap for differential expression of genes of human GBM specimens. Genes used for input are 289 differentially expressed genes with greater than 2-fold change in human GBM corresponding to genes in normal NSPCs of baboon SVZ, which are lack of detectable transcript levels (≤1 FPKM) and enriched by either H3K27me3, H4K20me3, or co-enriched with H3K27me3/H4K20me3. Inset shows symmetric color scale indicating differences in expression level as the (base 2) log of the fold change of GBM sample divided by control. Red indicates increased expression of genes in GBM relative to control, blue color indicates decreased expression of genes in GBM compared to control. SVZ-associated GBM1 and GBM2 exhibit expression level changes in genes involved in multiple biological functions. Colored bars in column on top of heatmap indicate H3K27me3/H4K20me3 enrichment of corresponding genes in NSPCs of baboon SVZ. Dendrogram was determined by hierarchical clustering using Euclidian distance and complete linkage. Red text box indicates functions of clustered genes upregulated in both GBM1 and GBM2, as predicted by IPA. Red and blue box indicates functions of clustered genes upregulated in GBM1 and downregulated in GBM2, as predicted by IPA. While there is no evident pattern of clustering of histone modifications with respect to particular GBM genes, there is a substantial increase in the number of upregulated GBM genes which correspond to H3K27me3 and H4K20me3 enrichment, yet lacking detectable transcripts in the normal NSPCs of baboon SVZ.

