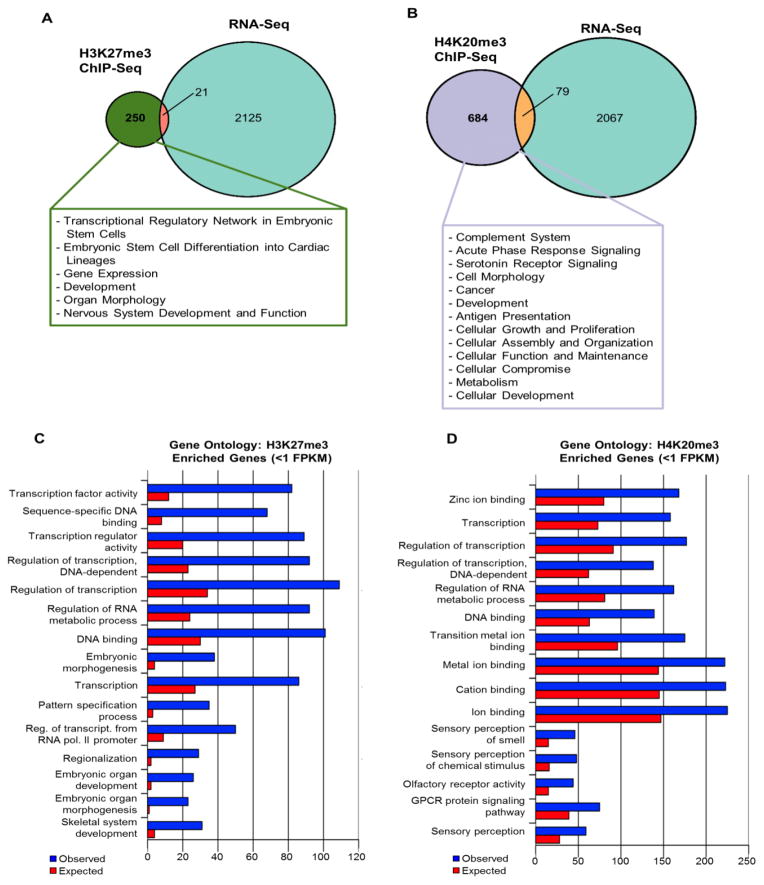
Fig. 3. H3K27me3 and H4K20me3 genome-wide enrichment patterns in baboon SVZ.
(A) Proportional Venn diagram representations of genes enriched with H3K27me3 compared to RNA-Seq detectable genes as determined using expression threshold of FPKM > 1.0. Text box indicates IPA predicted functions correlated to genes enriched with H3K27me3 but lacking transcripts (≤1 FPKM). Green portion indicates H3K27me3 enriched genes with no detectable transcripts (≤1 FPKM) (n=250), orange portion indicates H3K27me3 genes with detectable RNA levels (>1 FPKM) (n=21) and light blue portion represents RNA-Seq genes with >1 FPKM but lacking H3K27me3 modifications (n=2125).
(B) Proportional Venn diagram representations of genes enriched with H4K20me3 compared to RNA-Seq detectable genes as determined using expression threshold of FPKM > 1.0. Text box indicates IPA predicted functions correlated to genes enriched with H4K20me3 but lacking transcripts (≤1 FPKM). Purple portion indicates H4K20me3 enriched genes with no detectable transcripts (≤1 FPKM) (n=684); orange portion indicates H4K20me3 genes with detectable RNA levels (n=79); light blue depicts RNA-Seq genes with >1 FPKM but no H4K20me3 enrichment (n=2067).
(C) Gene Ontology (GO) analysis of H3K27me3 enriched genes lacking detectable transcripts (≤1 FPKM) categorizes genes based on known biological processes or molecular functions and top 15 significant GO terms associated with H3K27me3 enriched genes with no expression (Top 15 GO categories had Bonferroni corrected p-values ranging from 1.89×10−43 to 2.22×10⁻¹⁴). Significance of GO terms was calculated based on binomial distribution model plus Bonferroni correction.
(D) Gene Ontology (GO) analysis of H4K20me3 enriched genes lacking detectable transcripts (≤1 FPKM) for top 15 significant GO terms in either biological processes of molecular function categories (Top 15 GO categories had Bonferroni adjusted p-values between 1.57×10⁻²⁷ and 3.09×10⁻⁴). Significance of GO terms was calculated based on binomial distribution model plus Bonferroni correction.

