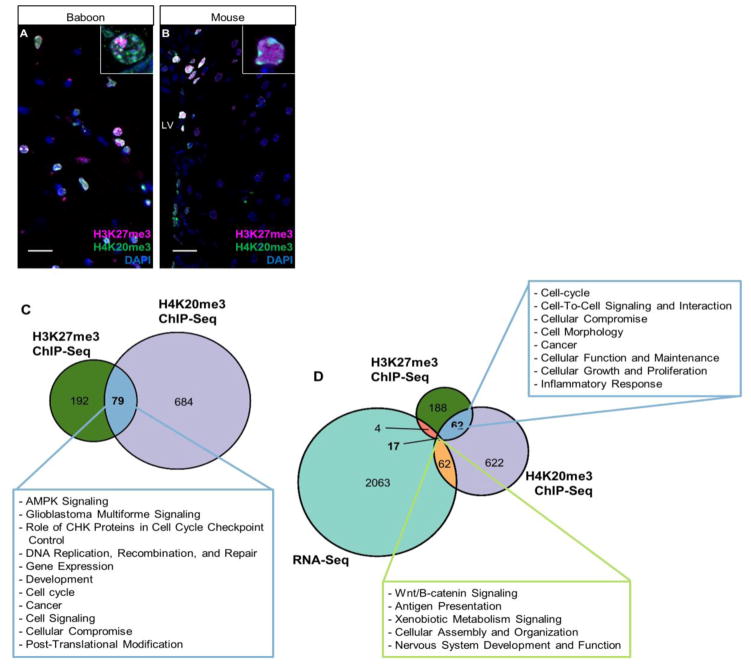
Fig. 4. Colocalization of H3K27me3 and H4K20me3 in NSPCs of baboon SVZ.
(A) Co-immunostaining of H3K27me3 and H4K20me3 in baboon brain. Region imaged corresponds to coronal section of the astrocytic ribbon within baboon SVZ. 40× magnification; Scale bar = 20 um. Inset shows 100× of H3K27me3 and H4K20me3 staining patterns.
(B) Co-immunostaining of H3K27me3 and H4K20me3 in mouse SVZ. 40× magnification; Scale bar = 20 um. Inset shows 100× of H3K27me3 and H4K20me3 staining patterns.
(C) Proportional Venn diagram generated by comparing numbers of genes enriched by H3K27me3, H4K20me3 or both histone modifications. Green area represents H3K27me3 enriched genes (n=192), purple represents H4K20me3 enriched genes (n=684), and blue area represents genes enriched by H3K27me3 and H4K20me3 (n=79). Text box describes functions of H3K27me3/H4K20me3 dual-enriched genes predicted by Ingenuity Pathway Analysis (IPA) software using known biochemical pathways and constructing de novo interaction networks.
(D) Proportional Venn diagram generated by comparing numbers of genes enriched by H3K27me3, H4K20me3 and genes detectable by RNA-Seq. Dark blue portion indicates genes enriched with H3K27me3 and H4K20me3 with no detectable transcription (≤1 FPKM) (n=62). Light green portion represents H3K27me3/H4K20me3 co-enriched genes with detectable RNA levels (>1 FPKM) (n=17).

