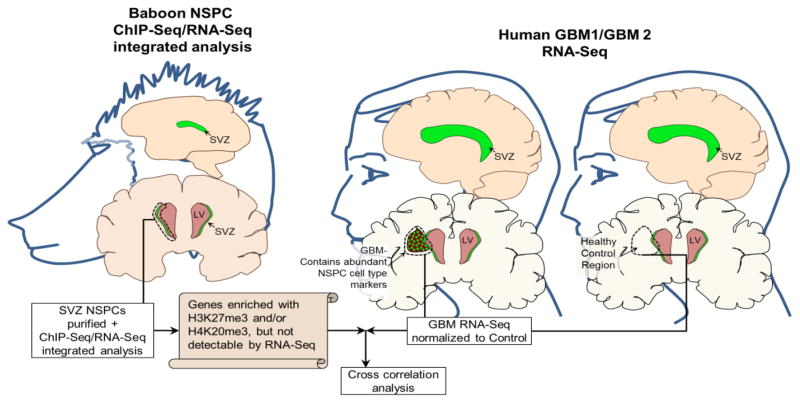
Fig. 7. Experimental Design for Correlation between genes in normal NSPCS enriched with H3K27me3 or H4K20me3 without detectable transcripts and genes altered in MRI-classified group I and group II GBM.
Graphical diagram illustrates the experimental design and analyses. Left panel: ChIP-Seq identified H3K27me3 and H4K20me3 enriched genes in normal NSPCs isolated from baboon SVZ and RNA-Seq analysis of normal NSPCs isolated from baboon SVZ. Right panel: RNA-Seq and Cuffdiff determined differential gene expression of human GBMI and GBMI compared to normal human specimens within correlated brain regions.

