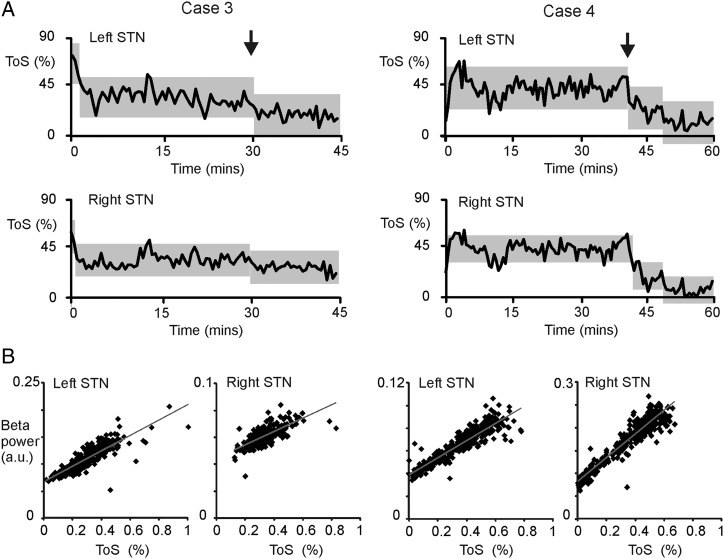
Figure 3.
Per cent ToS during prolonged aDBS after levodopa administration at time 0 and its dependency on β power. (A) Grey blocks indicate the periods of stable ToS as identified by change-point analysis (p<0.01). The vertical extent of the blocks denotes the confidence limits of blocks between significant change points and these blocks are centred on the mean of the stable period. The vertical arrows denote when clinical improvement due to levodopa was first manifest. ToS dropped at the onset of the clinical effect of levodopa. Note that prior to this, ToS was stable for about 30 min or more, suggesting that the progressive drop in ToS at the very outset of aDBS plateaued with continued aDBS. (B) Scatter plots of β power and ToS per 10 s block. Grey line is the product of linear regression. aDBS, adaptive deep brain stimulation; STN, subthalamic nucleus; ToS, time on stimulation.

