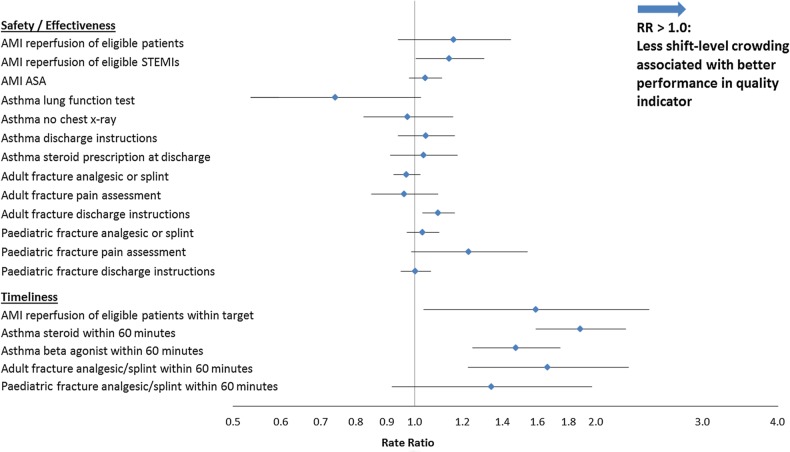
Figure 2.
Association between lower levels of shift-level crowding and quality of care indicators. The figure depicts the rate ratio of performance on specific quality indicators during periods of lower shift-level crowding (defined as the CTAS-specific average ED LOS of <4 h) compared with high shift-level crowding (≥8 h). As shown in the figure, performance on four of the five quality indicators reflecting timeliness was better during periods of lower shift-level crowding. None of the other indicators was associated with shift-level crowding. AMI, acute myocardial infarction; ASA, acetylsalicylic acid; CTAS, Canadian Triage and Acuity Scale; ED, emergency department; LOS, length of stay; STEMI, ST-elevated myocardial infarction.

