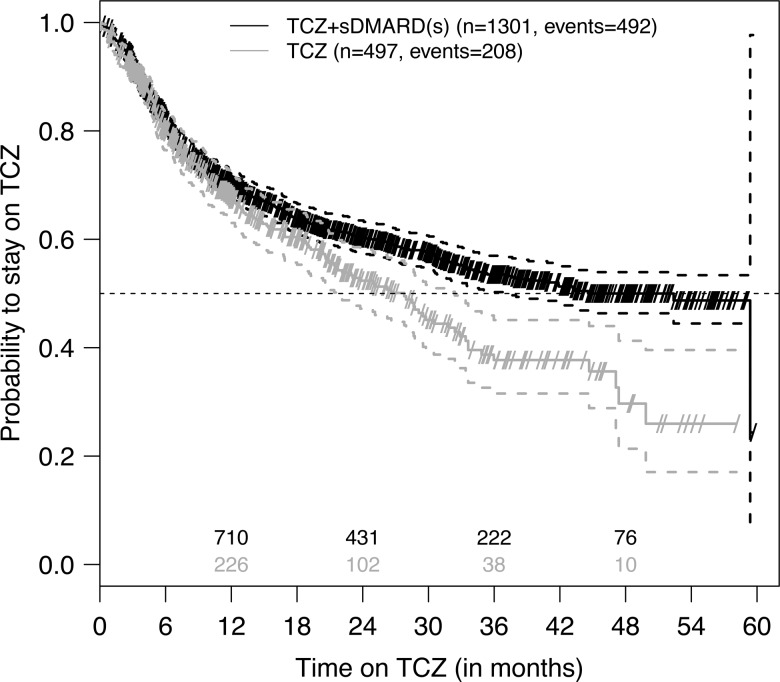
Figure 3.
Kaplan–Meier plot of tocilizumab (TCZ) retention by TCZ treatment. These unadjusted data represent all 1798 eligible patients. Small diagonal lines indicate censored retention times (at date of last follow-up visit), dashed lines 95% CIs for the survival curves and numbers above the x-axis denote the numbers of patients known to be still at risk for TCZ discontinuation (ie, still on TCZ and not yet lost to follow-up). Treatment groups ‘TCZ’ and ‘TCZ+ synthetic disease-modifying antirheumatic drugs (sDMARD(s))’ represent TCZ as monotherapy and in combination with sDMARDs, respectively. For ‘TCZ+sDMARD(s)’ the upper 95% CI line does not cross the 50% line for the probability to stay on TCZ resulting in an unestimable upper 95% CI limit for the median retention time.

