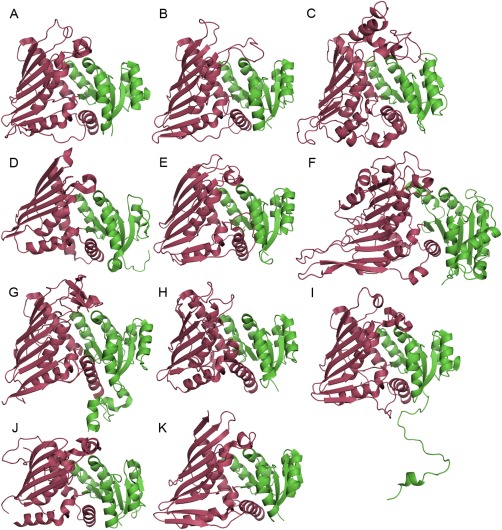
Figure 1.

The cartoon representation of monomers of the proteins used in the comparison: (A) AAOR, (B) AFR, (C) A‐zyme, (D) BVR, (E) DD, (F) G6DP, (G) Gal80p, (H) IDH, (I) GFOR, (J) WlbA, (K) KijD10. The N‐terminal nucleotide‐binding domains are in green and the C‐terminal domains in red.
