
Figure 2.
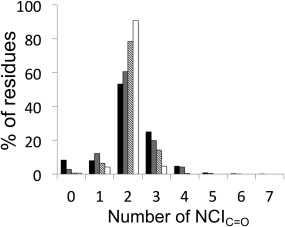
The percentages of NCIC=Os per residue made across all residues in proteins. These were measured in three ways: across all residues in the initial, unsolvated high‐resolution crystal structures (black bars); across all residues and snapshots from the last 81ns of a molecular‐dynamics simulation (gray bars); from the distribution of modal averages of all residues across the same set of molecular‐dynamics simulation snapshots (diagonal bars); across all residues and snapshots for those residues that spend at least half of their molecular‐dynamics simulation at their modal average number of NCIC=O (white bars).