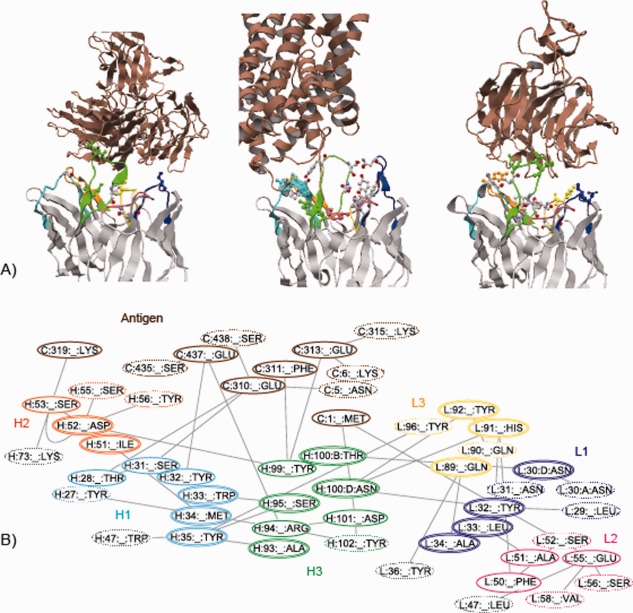
Figure 4.

Hydrogen bond networks around antibody–antigen interaction sites. A) The structures of three antibody–antigen complexes (from the left, 2qqk, 3gi9, and 3sob). The antibody–antigen and nonconserved interloop HBs are shown in ball and stick models, where the former is colored in the same manner as in Figure 3(A), and the latter is colored cpk. The antigen molecules are colored brown. B) The hydrogen bond network in 3gi9. The hydrogen bond network that comprises the residues involved in antibody–antigen and interloop HBs, was calculated by RINerator26 and drawn by Cytoscape 3.3.0.27, 28 The residues enclosed by single or double line are directly involved in antibody–antigen or interloop HBs, respectively. The other related residues are enclosed by dotted line. The non‐CDR residues are enclosed by light‐gray line.
