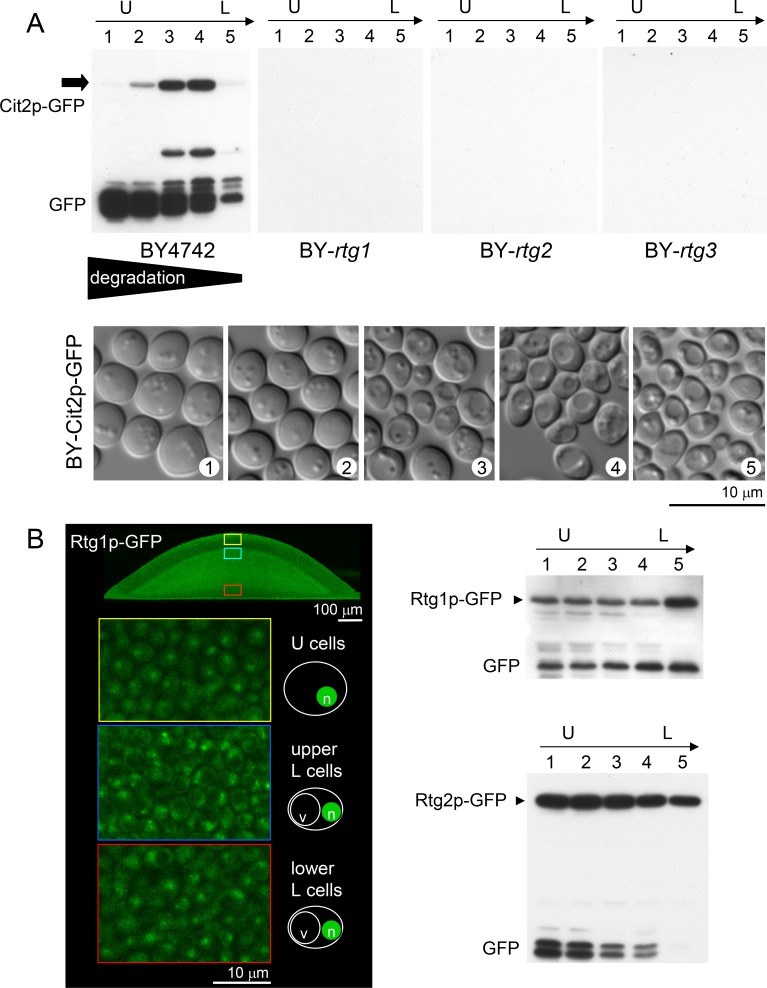
Figure 3. Comparison of amounts of Cit2p-GFP, Rtg1p-GFP and Rtg2p-GFP in different subpopulations of giant colonies.
A. WB analysis of the amount of Cit2p-GFP in 5 cell layers (1-5) separated from 14-day-old alkali phase colonies formed by wt and rtgΔ strains, starting from the top of the colony (i.e., from upper U cells, layer 1) and ending at the lowest layers of L cells near the agar. The lower panel shows the morphology of cells from layers 1-5 separated from wt colonies producing Cit2p-GFP that were used for WB analysis. B. Left panel, localization of Rtg1p-GFP in cells from microcolonies (4-day-old) of colony cross-sections as determined by 2PE-CM. Nuclear localization in U cells and in both types of L cells is shown on magnified images marked in color in colony cross-sections. Right panels, comparison of Rtg1p-GFP and Rtg2p-GFP amounts in 5 cell layers (1-5 as in A) of 14-day-old alkali-phase wt colonies by WB. Loading controls are in Figure S5.

