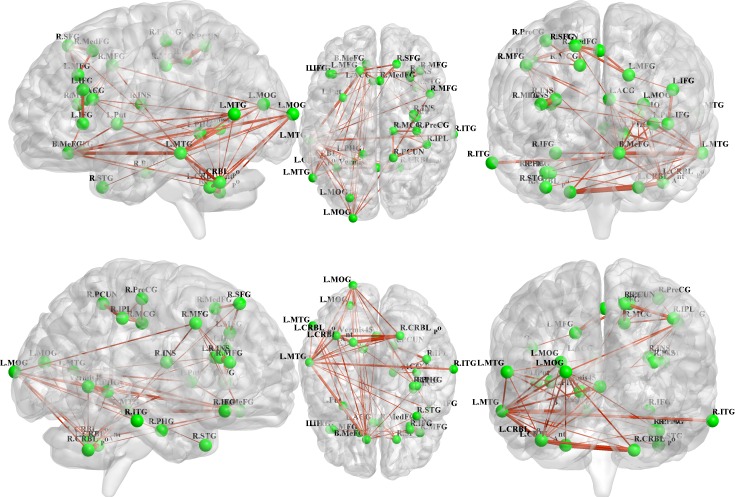
Figure 2. All 31 regions extracted from the genotype-by-aMCI interactions for the cholesterol pathway, after correcting for imaging space for any one SNP [Pcorrected(S) < 0.05], were used to delineate a unidirectional weighted network with 31 nodes and 465 edges that globally described the network connectivity pattern of the control group.
In the present study, three correlation coefficient thresholds (r = 0.3, r = 0.5 and r = 0.7) were tested. This figure shows the network for r = 0.3, while the networks for r = 0.5 and r = 0.7 are shown in the Supplementary Materials (Part III). The figure was created using BrainNet Viewer (http://www.nitrc.org/projects/bnv/).

