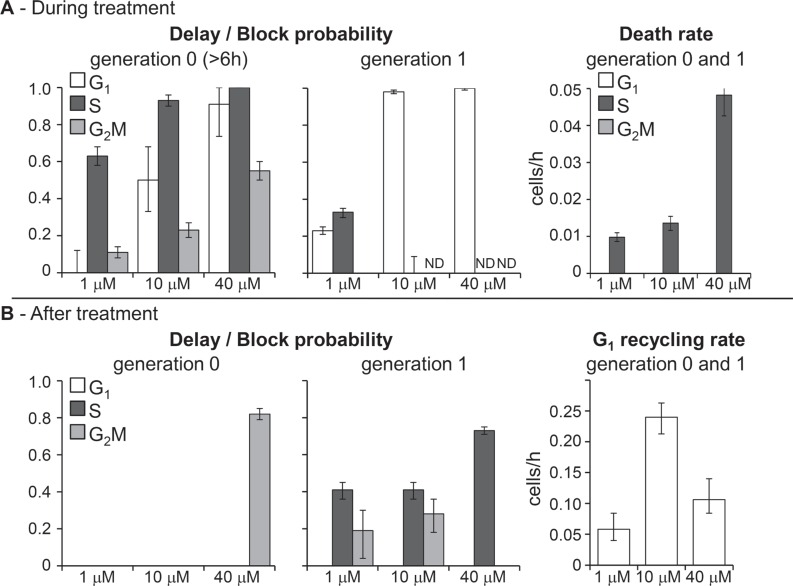
Figure 2. Parameters describing checkpoint activities in the best-fit model of erlotinib.
(A) Delay and block probability in G1, S and G2M during treatment (left panel). The effect was different for undivided cells (generation 0) and their descendants (generation 1). In generation 0, delay and blocking activity were time-dependent and reached the half-maximum 6 h after the beginning of treatment. In generation 1, block and delay were constant. Death rate of cells blocked in G1 or traversing S phase (right panel). (B) Cytostatic effects still present after treatment (left panel). No mortality was observed. Recycling rate of cells exiting G1 block was set equal in generation 0 and 1 and reached half-maximum at the end of treatment (48 h) (right panel). Error bars were calculated by applying the uncertainty analysis described in Supplementary Methods.

