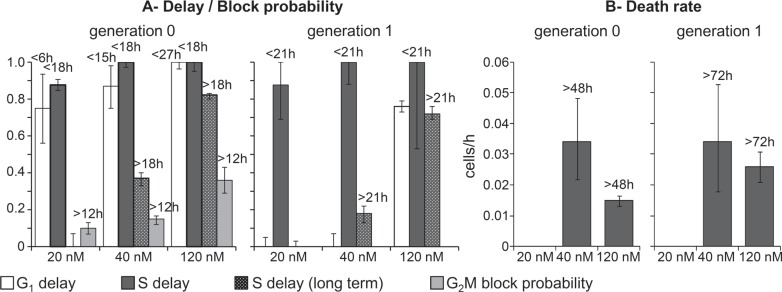
Figure 3. Parameters describing checkpoint activities in the best-fit model of gemcitabine.
(A) Dose-dependence of maximum delay and block probability in G1, S and G2M in generations 0 and 1. Long-term S phase delay was not zero with 40 nM and 120 nM. (B) Death rate of cells traversing S phase in generations 0 and 1. Time-dependent parameters reached half-maximum at the times reported over each column. Error bars were calculated as in Figure 2.

