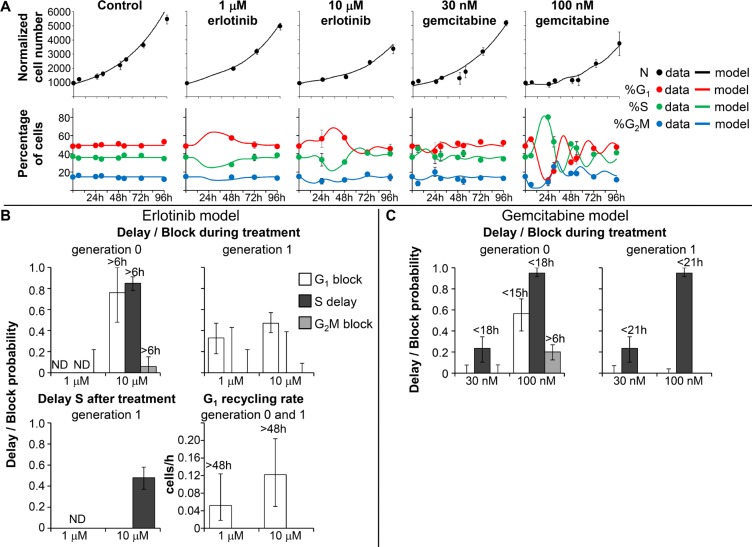
Figure 4. Experimental data and model prediction in Capan-1 cells.
(A) Time courses of cell number and flow cytometric percentages obtained from the final model (continuous lines) compared with experimental data (symbols) for untreated Capan-1 cells and samples exposed to erlotinib and gemcitabine. The symbols and error bars represent the mean and standard deviation of experimental data of three independent experiments. (B) Parameters describing checkpoint activities in the best-fit model of erlotinib. Delay and block probability in G1, S and G2M during treatment differed for undivided cells (generation 0) and their descendants (generation 1). Time-dependent parameters reached half-maximum at the times reported over each column. (C) Parameters describing checkpoint activities in the best-fit model of gemcitabine. Error bars in panels B and C were calculated by applying the uncertainty analysis described in Supplementary Methods.

