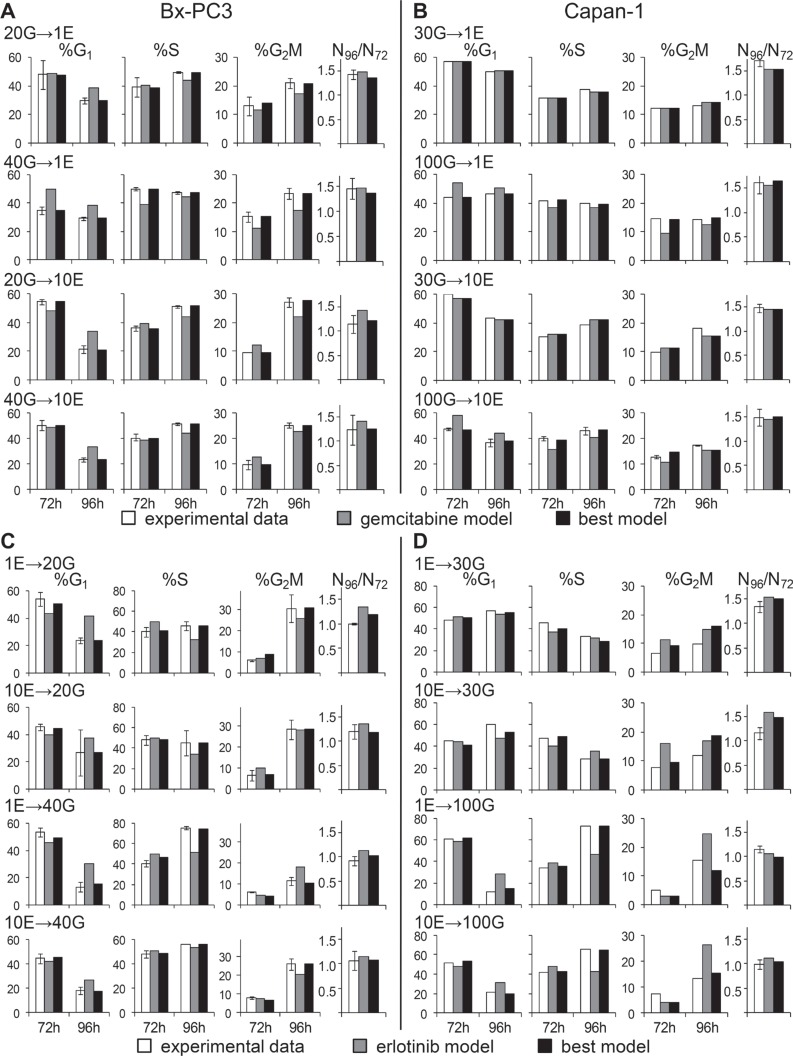
Figure 5. Experimental data from cell count and flow cytometric analysis after combined treatments compared with the best-fit model and the second drug model.
%G1, %S, %G2M and cell number increases between 72 h and 96 h were compared in BxPC-3 and Capan-1 after the G→E sequence (panels A and B) and after the E→G sequence (panels C and D).

