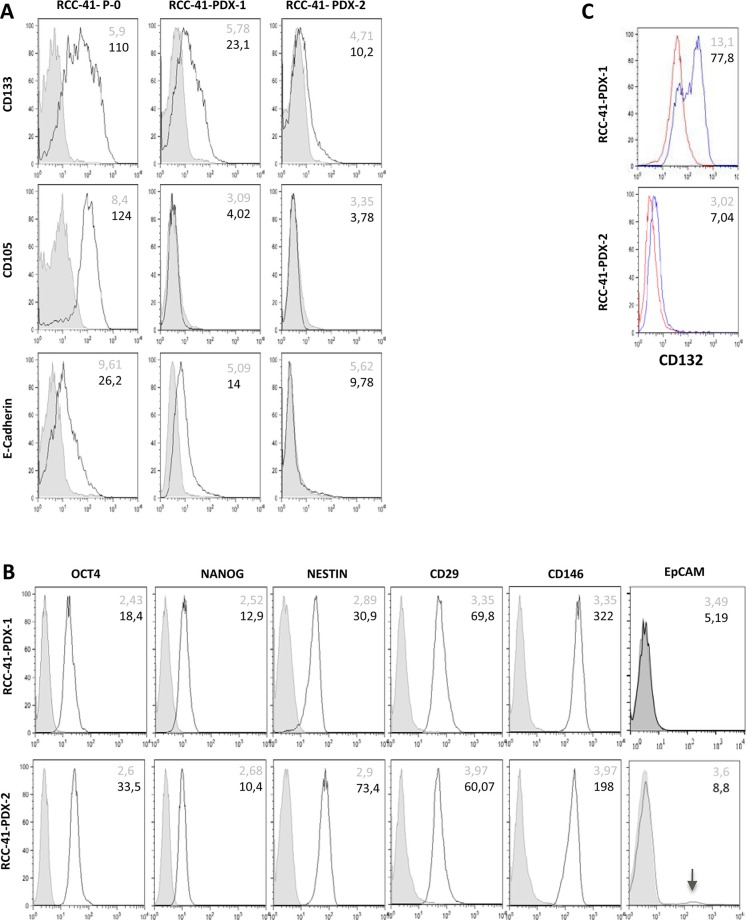
Figure 1. Differential expression of cell surface markers in serially xenografted RCC-41 cells.
(A, B, C) The indicated cell surface markers were analyzed in primary human cell suspension from RCC-41 tumor sample (RCC-41-P-0) and in cell suspensions from RCC-41 patient derived xenograft (RCC-41-PDX-1, RCC-41-PDX-2). Grey histograms correspond to cells incubated with the isotype-matched control antibody, and black outline histograms correspond to the analyzed markers. Grey numbers within panels correspond to Mean Fluorescence Intensity (MFI) of cells incubated with the isotype-matched control antibody, while black numbers correspond to MFI of the analyzed markers.

