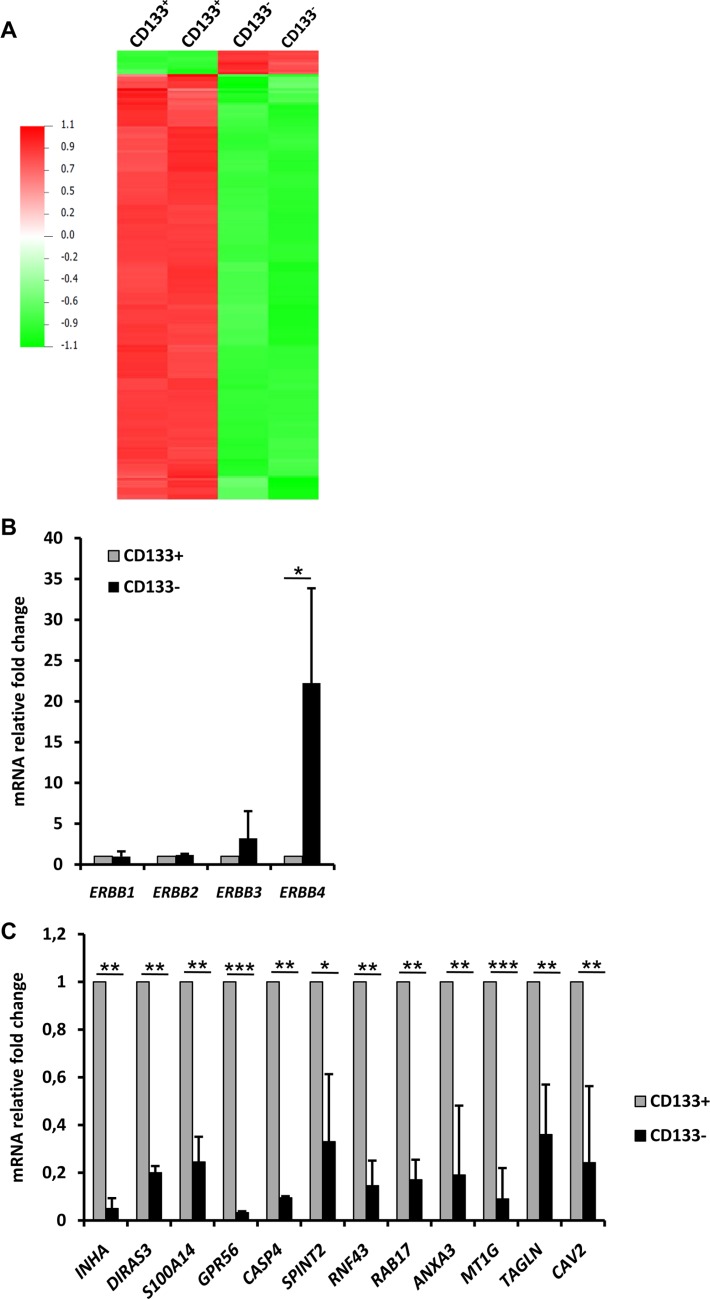
Figure 4. mRNA expression profiles of RCC41-PDX-2/CD133− and RCC41-PDX-2/CD133+ subsets.
(A) Microarray analysis of CD133+ and CD133− RCC41-PDX-2 cells. Two independent biological replicates are represented. (B, C) Comparative mRNA expression of ERBB receptors (B) and tumor suppressor genes (C) in CD133− and CD133+ RCC41-PDX-2 cells by RT-qPCR. Presented results are mean of three independent experiments with *p < 0.05, **p < 0.005, and ***p < 0.0005.

