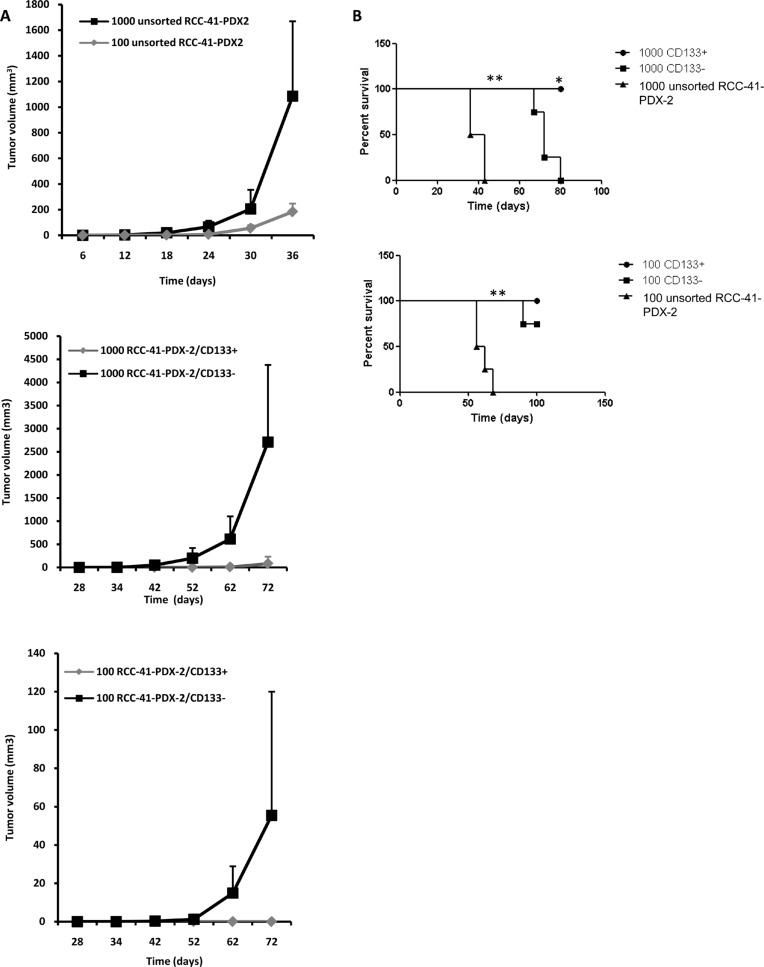
Figure 6. Tumorigenic potential of human renal RCC-41-PDX-2 and RCC-41-PDX-2 subsets in SCID mice.
(A) Tumor formation of unsorted RCC-41-PDX-2, and freshly sorted RCC-41-PDX-2/CD133− and RCC-41-PDX-2/CD133+ cells in SCID mice as a function of number of injected cells 102 and 103 cells of each cell subtype were subcutaneously injected into SCID mice (n = 4 per group). Represented is the time for evaluation of tumor volume (mm3). Data are representative of 3 independent experiments with similar results. (B) Representation of tumor growth rate using survival curve. Death corresponds to a xenografted tumor reaching 1500 mm3. Data are representative of 3 independent experiments with similar results. *and **in (C) indicates respectively p < 0.05 and p < 0.005 by the log-rank test.

