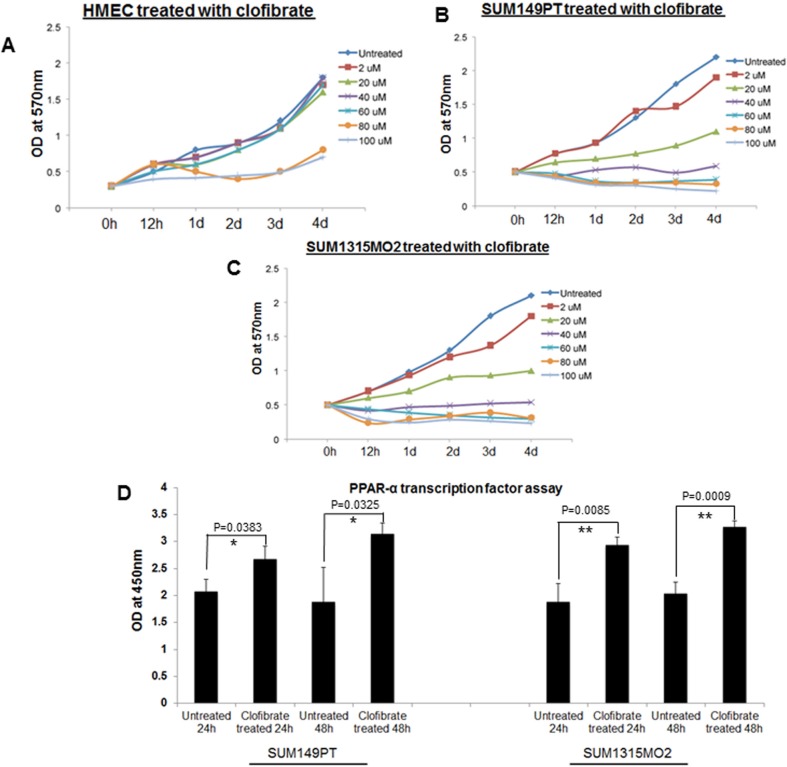
Figure 4. Effect of clofibrate treatment on cell proliferation.
MTT cell proliferation assay was performed in A. HMEC, B. SUM149PT, and C. SUM1315MO2 cells, which were treated with clofibrate as indicated, and the levels of tetrazolium MTT was measured by a spectrophotometer at 570nm. D. Effect of clofibrate treatment on PPRE binding activity of PPARα in breast cancer cell lines. SUM149PT and SUM1315MO2 cells were treated for 24 h and 48 h with 20 μM clofibrate and nuclear extracts were prepared and tested for PPRE binding activity. Results represent the absorbance detected at 450nm. Readings are the mean ± SD of three separate experiments from three different preparations for each condition. * denotes statistically significant and ** represents statistically highly significant.

