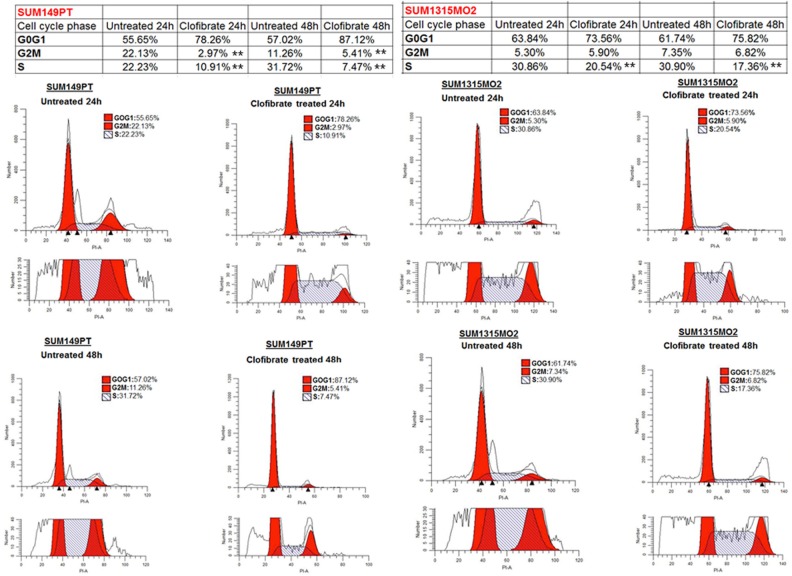
Figure 9. Effect of clofibrate on breast cancer cell cycle events.
SUM149PT and SUM1315MO2 cells were untreated or treated with 20 μM clofibrate. Cells were collected at 24 h and 48 h post-treatment to examine the cell cycle profile by propidium iodide (PI) staining. The cells were neither replenished with fresh media nor supplemented with the drugs during the 48 h time period. In each representative panel, the horizontal and vertical axis corresponds to the relative DNA content and the number of cells, respectively. The percent of cells in G0G1, S, and G2M phase for untreated and clofibrate treated at the indicated time points was calculated by Modfit 3.2 software. The data is representative of three independent experiments. ** represents statistically highly significant.

