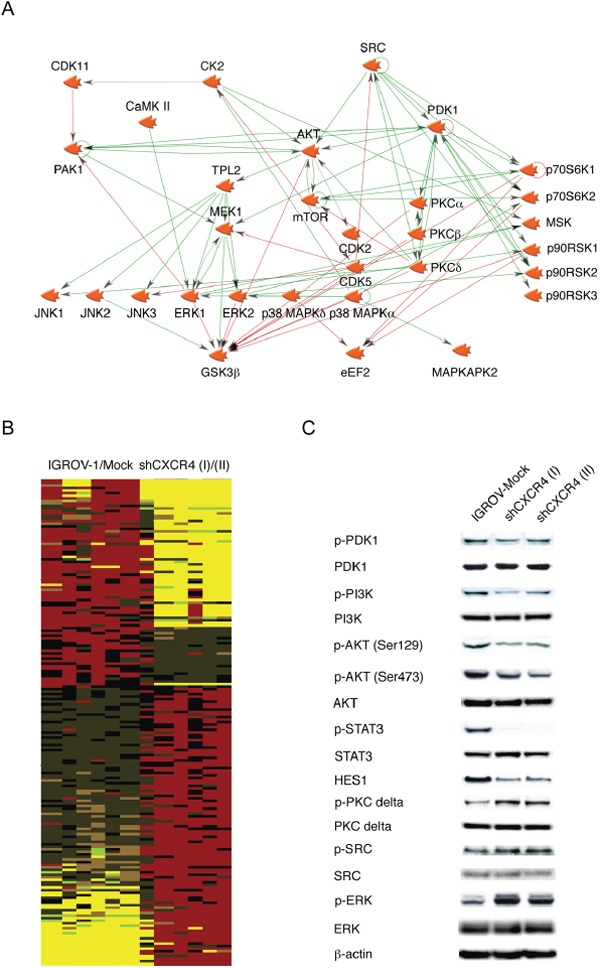
Figure 1. Phosphoprotein profiling of human ovarian cancer cell lines.

A. A network of putative constitutively active kinases in IGROV-1 cells was created using Genego's Metacore pathway analysis tool. Interactions between any two objects are depicted by an arrow indicating the direction of interaction. B. Heatmap containing three samples in each group of statistically significantly differentially phosphorylated proteins were generated using IGROV-1 and IGROV-Mock transfected versus two independently isolated clones of IGROV-1 cells stably transfected with shRNA to CXCR4 (I and II). Increases in phosphorylation are shown as pseudocolour red and decreases in yellow. C. Western blot analysis of selected kinases associated with the phenotype of high cytokine expression and downstream effect on phospho-STAT3 and NOTCH signaling in malignant cells.
